
Autoscaling AI Workloads on Kubernetes With KEDA and What it Means for Agentic Systems

TL;DR — Key Takeaways
- CPU and memory are often the wrong scaling signals for bursty AI workloads. Queue depth can reveal demand before serving pods become resource constrained.
- KEDA scales Kubernetes workloads from external event sources, making it well suited to inference queues and agent task backlogs.
- Thresholds and cold starts matter. Teams need to tune scaling against real traffic and may want a warm minimum replica to absorb sudden bursts.
A few months back, I hit a wall with a model-serving environment running on Kubernetes. It was scaled the way most things get scaled at first: Horizontal pod autoscaling (HPA), watching CPU and memory. That worked fine when traffic was steady. It fell apart the moment traffic wasn’t.
Inference traffic doesn’t look like normal web traffic. Request volume can sit low for a while, then spike hard the second a batch job upstream finishes or a scheduled job kicks off a wave of scoring requests. CPU and memory don’t move fast enough or in the right direction to catch any of that. By the time the pods scaled up, the backlog had already piled up. By the time they scaled down, someone was paying for idle compute nobody needed.
Why HPA Falls Short Here
Standard HPA reacts to resource usage inside the pod. That’s the wrong signal for workloads like this because a serving pod can be sitting there using almost no CPU while a queue behind it is quietly filling up. The thing that should trigger scaling isn’t “Is the pod working hard?”; it’s “Is there work waiting?”
I’ll save you the question I get asked a lot when this comes up: Yes, HPA can technically scale on external metrics too, through a metrics adapter and the external metric type. That route is worth considering first, honestly, since it means one less thing to introduce into the stack. It’s doable. It’s also more plumbing than it sounds. You’re standing up and maintaining a metrics adapter, wiring it into the metrics server and hand-rolling a lot of the scaler logic that already exists and is tested in Kubernetes Event-Driven Autoscaling (KEDA). For one workload, it might be fine. Once there are multiple serving deployments, each needing their own event source, maintaining that by hand stops making sense quickly.
Where KEDA Fits In
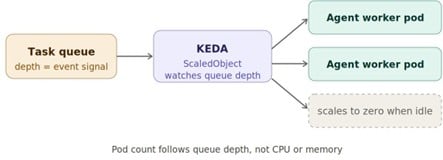
KEDA scales based on external event sources instead of internal resource metrics. Instead of asking, “How busy is this pod?” it asks, “How much work is queued up somewhere else?” and scales workers up or down based on that.
For a model-serving setup, that maps almost perfectly to the actual problem. Point KEDA at an event source, such as a message queue feeding inference requests, and it scales the number of serving pods based on how deep that queue is, not how hard the existing pods are working.
What This Actually Looked Like
The core building block in KEDA is a ScaledObject. You define which deployment it controls, which event source to watch and the threshold that triggers scaling. Stripped down to the essentials, it looks something like this:
apiVersion: keda.sh/v1alpha1 kind: ScaledObject
metadata:
name: inference-worker-scaler spec:
scaleTargetRef:
name: inference-worker minReplicaCount: 1
maxReplicaCount: 30
cooldownPeriod: 60 triggers:
– type: gcp-pubsub metadata:
subscriptionName: inference-request-queue mode: SubscriptionSize
value: “5”
That last block is doing the real work. It tells KEDA: Watch this Pub/Sub subscription, and for every five unprocessed messages, that’s roughly one more worker pod’s worth of demand. Below that threshold, it scales down. Given enough idle time, it scales all the way to zero, although there’s a floor of one set here. More on why in a minute.
That last part matters more than it might sound. Scale-to-zero means you’re not paying for serving pods sitting around waiting for something to do. For workloads that are genuinely bursty, that’s real money, not a rounding error.
- A rough architecture includes the following:
- Requests land in a queue (Pub/Sub, Redis, RabbitMQ, whatever fits your stack)
- KEDA watches queue depth through a scaler tied to that source
- As depth increases, KEDA scales the serving deployment up
- Workers drain the queue
- As depth drops, KEDA scales back down, eventually to zero if the queue’s empty
None of this requires much change to the application code. KEDA sits alongside the existing deployment and manages the scaling decision from outside.
Picking an Event Source
There are three realistic options here, and the trade-offs are worth knowing before picking one.
Pub/Sub (or SQS, if you’re on AWS) is the easiest to reason about. Subscription size is a clean, native concept, and KEDA’s scaler for it just works without much tuning. The downside is that it’s a managed service, so you’re tied to your cloud provider’s latency and quota characteristics.
Redis (via lists or streams) is fast and gives you more control, and it’s a reasonable choice if you’re already running Redis for caching elsewhere. The trade-off is that you’re now responsible for that Redis instance’s availability too. If it goes down, your scaling signal goes down with it.
RabbitMQ sits in between — more features than Pub/Sub (dead-letter queues, routing, priority), more operational overhead than a managed Pub/Sub service. It’s worth serious consideration if another team nearby already runs it, but the operational overhead is a real cost for something that’s fundamentally just a request queue.
Pub/Sub tends to make sense when you’re already on Google Cloud and don’t want to introduce a new stateful service just for this. The right answer reasonably differs depending on what’s already running.
The Part That’s Easy to get Wrong
Thresholds matter more than people expect going in. Set them too aggressive, and you’ll thrash, scaling up and down constantly for small fluctuations, which is its own kind of expensive and annoying. Set them too conservatively, and you’re back to the same lag problem HPA had, just with a better trigger.
It’s worth tuning thresholds by actually watching real queue behavior for a couple of weeks before locking anything in, rather than guessing at round numbers up front. That feels slow in the moment. It saves a lot of time you’d otherwise spend redoing the config two or three times later.
Cold-start time is the other thing worth planning for early. If serving pods take 30 seconds to boot, scaling from zero means the first burst of traffic waits 30 seconds no matter how good the KEDA config is. That’s the reason minReplicaCount isn’t zero in the example above: Keeping one warm worker around specifically absorbs that gap. It gives up a small amount of the scale-to-zero savings during genuinely quiet periods, but it means the first request after a quiet stretch doesn’t sit there waiting on a cold boot.
Keeping an Eye on it Once it’s Running
Getting the config right is only half the job. You also want to actually know whether it’s behaving the way you think it is once it’s live.
The two things worth watching most closely are queue depth over time and pod count over time, plotted together. If they track each other reasonably well, with pod count rising shortly after depth rises and falling shortly after, that’s a good sign the thresholds are doing their job. Queue depth spiking while pod count stays flat usually means the threshold’s too conservative. Pod count jumping around constantly while queue depth barely moves usually means thrashing, and the threshold’s too tight.
KEDA also exposes its own metrics, which is worth wiring into whatever’s already being used for observability rather than treating them as a separate thing to check. Nothing exotic is needed here; a couple of panels on an existing dashboard are usually enough to catch tuning issues early.
Where This Points for Agentic Systems
This pattern showed up for model serving, but the more I’ve looked at agentic AI workloads, the more I think it applies there even more directly.
Agent workloads have an even more extreme version of the burstiness that shows up with inference. A support agent might sit idle for 10 minutes, then get slammed with 40 tasks the second a queue backs up. A document-processing agent might spike hard right after a batch job lands, then go quiet for an hour. That’s the same queue-depth-driven scaling problem, just with wider swings and more unpredictable timing, since agent work is triggered by events and tool calls rather than steady request traffic.
The architecture doesn’t need to change much to fit. Swap the inference request queue for a task queue feeding agent workers, and the same ScaledObject pattern, the same threshold tuning lessons and the same cold-start trade-offs carry over directly. If anything, the case for event-driven scaling over CPU/memory-based HPA gets stronger for agents, since agent workers can be doing meaningful work — waiting on a tool call or reasoning through a multi-step task — while barely touching CPU at all.
If you’re building agent infrastructure on Kubernetes and still scaling on CPU and memory, it’s worth asking whether that’s actually measuring the thing that matters. Based on what shows up with model serving, for a lot of agent workloads, it probably isn’t either.
Have you run into this same mismatch with bursty AI workloads and standard autoscaling, whether serving models or running agents? I’d be curious what event source you ended up choosing and why.
Frequently Asked Questions
Why can HPA struggle with AI inference workloads?
A queue can build while existing pods still show low CPU or memory utilization, so resource-based autoscaling may react only after latency and backlog have already increased.
What event sources can KEDA use?
Common choices include cloud messaging systems such as Google Pub/Sub or AWS SQS, Redis, RabbitMQ and many other supported external triggers.
Should AI workloads always scale to zero?
Not necessarily. Scale-to-zero can save money, but workloads with significant cold-start times may benefit from keeping one or more workers warm to handle the first burst quickly.
