Grafana Labs Advances Prometheus for the Enterprise
Grafana Labs has made available version 1.0 of Cortex, a monitoring platform that extends the core open source Prometheus project made available under the auspices of the Cloud Native Computing Foundation (CNCF).
Tom Wilkie, vice president of product for Grafana Labs, says Cortex is an enterprise-class implementation of Prometheus that enables IT teams to query metrics across multiple instances of Prometheus. Most organizations today need to deploy an instance of Prometheus on each Kubernetes cluster they are seeking to manage. Cortex provides a means to launch queries in real-time against tens of billions of data points.
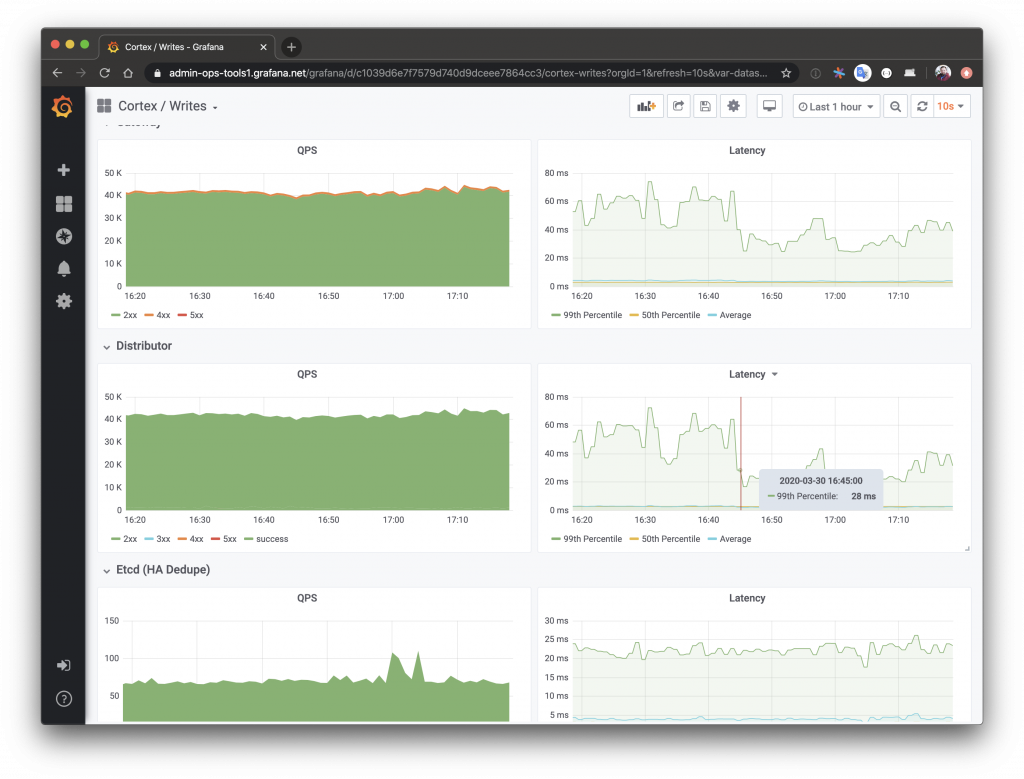
Available under an open source Apache license, Cortex 1.0 comes with turnkey Grafana dashboards and Prometheus alerts as well as providing access to a “single process” mode that makes it easier to deploy than Prometheus instances that developers might otherwise download.
Grafana Labs also gives IT organizations the option to deploy Cortex on-premises or invoke it as a managed hosted service. Cortex has also been designated a “sandbox” project by the CNCF, which along with Prometheus oversees the development of Kubernetes.
Wilkie said there are now more than 25,000 active instances of Prometheus. Many of those instances have been implemented by individual DevOps teams during the development of an application. Those teams are now looking for ways to operationalize Prometheus at scale within an enterprise-class production environment, he says.
Wilkie notes the continuing shift toward open source metrics will lead to more applications being instrumented, which in turn will increase the adoption of monitoring platforms optimized for cloud-native applications. In contrast, most legacy applications if instrumented at all are relying on commercial agent software that is optimized for a single monitoring platform. That approach has tended to limit overall application observability.
Of course, providers of commercial monitoring tools contend most organizations will need to monitor legacy monolithic applications alongside emerging microservices-based applications for many years to come. The one thing all providers of IT monitoring tools can agree on is that as IT becomes more complex, it would not be possible to manage modern IT environments without relying more heavily on monitoring tools. In fact, as a core tenet of any best DevOps practice, monitoring and instrumentation are now core requirements. The chicken-and-the-egg debate now is determining to what degree will adoption of Kubernetes and microservices serve as a forcing function that drives increased adoption of best DevOps practices more widely or whether organizations have to embrace DevOps prior to being able to effectively build and deploy applications on Kubernetes clusters.
Regardless of the path chosen, there’s no doubt Prometheus, Kubernetes and DevOps are all intimately linked. The next challenge will be determining how roles within the IT organization itself will evolve as monitoring tools become more accessible to both developers and IT operations teams alike. The simple truth is most developers and IT operations teams today don’t share access to same monitoring data in real-time today anyway, so on one level the only place most organizations have to go from a DevOps perspective is up.


