Building FinOps With k0rdent Open Source
Managing cloud finances across multi-cluster Kubernetes environments is a challenge that platform teams face daily. Although monitoring tools exist, most teams still struggle to connect infrastructure data to actionable cost-saving decisions. What’s missing is a practical way to quickly build and run specialized FinOps solutions that fit your organizational context without reinventing the wheel each time.
This article discusses how open-source k0rdent and k0rdent Observability and FinOps (KOF) enable teams to deploy custom FinOps capabilities such as predictive cost forecasting and actionable savings recommendations at scale.
The Foundation
Think of k0rdent and KOF as your standardized foundation for building custom business solutions.
- k0rdent: At its core, k0rdent is an orchestration engine designed to tame the chaos of Kubernetes sprawl. It provides a centralized way to manage and standardize operations across hundreds or thousands of clusters, ensuring consistency and control.
- KOF: Built on top of k0rdent, KOF is the unified observability layer for the entire multi-cluster environment based on OpenTelemetry and Prometheus. It provides standardized pipelines that feed clean, consistent data to whatever logic needs to be built.
Together, they eliminate the “reinvent the wheel” problem for platform engineers.
The ‘Lego-Brick’ Pattern: Build Your Own FinOps Engine
The power of k0rdent + KOF lies in its composable architecture. Think of it as the standardized LEGO baseplate, and your custom solutions as specialized bricks that snap perfectly into place.
The FinOps Agent is one such brick that snaps into the infrastructure and provides foresight and optimization. The beauty of this model lies in its standardization.
- Standard Ingestion: The agent consumes industry-standard Prometheus metrics, which systems already produce.
- Standard Export: It outputs its forecasts and recommendations as simple JSON files. This universal format ensures that the data can be easily sent to Grafana for visualization, stored in any database or fed into other custom tools.
This approach empowers users to continuously enhance their multi-cluster Kubernetes platforms by developing custom components tailored to unique business challenges.
Introducing the FinOps Agent
The FinOps Agent leverages the Time Series Optimized Transformer for Observability (TOTO) model to deliver enterprise-grade forecasting capabilities. Its real business value comes from transforming standard Kubernetes metrics into actionable financial insights across the entire infrastructure.
It seamlessly plugs into the existing monitoring stack and delivers:
- Predictive cost forecasting to provide visibility of the future of cloud expenses
- Zero-shot learning, which works out of the box without requiring training
- Unified multi-cluster visibility through intelligent data aggregation
- Actionable optimization recommendations with clear, dollar-amount savings
It follows a simple workflow.
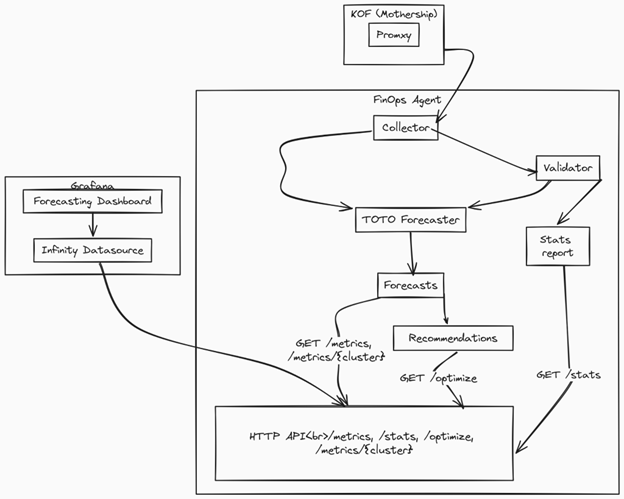
- Collect: It ingests Prometheus and OpenCost metrics from the KOF observability pipeline.
- Forecast: It uses the cutting-edge TOTO model to generate zero-shot predictions for cost and utilization.
- Advise: It runs the forecasts through a deterministic recommendation engine to identify idle resources and provide safe, guard-railled optimization actions.
- Validate: It continuously runs backtests to measure its own accuracy (MAPE, MAE, etc.), ensuring that the forecasts are trustworthy.
- MAPE: Mean Absolute Percentage Error — measures forecast accuracy as a percentage.
- MAE: Mean Absolute Error — measures the average magnitude of forecast errors.
- Expose: It delivers these insights via a simple REST API and pre-configured Grafana dashboards.
A Deeper Dive into the Architecture
The FinOps Agent follows a modular, microservices-inspired architecture that separates concerns while maintaining simplicity.
Robust Data Collection
Accurate forecasting and, by extension, actionable cost-saving recommendations depend entirely on the quality and granularity of the data.
The FinOps Agent follows a structured collection pattern to ensure coverage at the right aggregation levels (cluster-wide, node-specific) and with configurable temporal resolutions (from 1 minute to 1 hour). This makes forecasts more accurate and recommendations more trustworthy.
The Input Contract
This block defines the PromQL contract that the FinOps Agent expects from KOF. At the cluster scope, we build the target cost series and normalization baselines (CPU %, memory %, node count, total memory) used by the forecaster. At the node scope, we collect per-node cost and utilization to detect idle capacity and quantify removal savings.
# Cluster-level queries
CLUSTER_QUERIES = {
“cost_usd_per_cluster”: “sum(node_total_hourly_cost) by (cluster)”,
“cpu_pct_per_cluster”: “100 * (1 – avg by (cluster) (rate(node_cpu_seconds_total{mode=\”idle\”}[5m])))”,
“mem_pct_per_cluster”: “100 * (1 – avg by (cluster) (node_memory_MemAvailable_bytes / node_memory_MemTotal_bytes))”,
“node_count_per_cluster”: “count by (cluster) (kube_node_status_condition{condition=\”Ready\”,status=\”true\”})”,
“mem_total_gb_per_cluster”: “sum by (cluster) (node_memory_MemTotal_bytes) / 1024 / 1024 / 1024”,
}
# Node-level queries
NODE_QUERIES = {
“cost_usd_per_node”: “sum by (cluster, node) (node_total_hourly_cost)”,
“cpu_pct_per_node”: “100 * (1 – avg by (cluster, instance) (rate(node_cpu_seconds_total{mode=\”idle\”}[5m])))”,
“mem_pct_per_node”: “100 * (1 – avg by (cluster, instance) (node_memory_MemAvailable_bytes / node_memory_MemTotal_bytes))”,
“cpu_total_cores_per_node”: “sum by (cluster, instance) (machine_cpu_cores)”,
}
Reliable Long-Range Queries
Collecting this much data reliably at scale is non-trivial; long-range Prometheus queries can time out or exhaust memory. The agent solves this by automatically chunking large queries into smaller, manageable pieces, ensuring data-handling at scale without failure.
def _execute_chunked_query(self, promql: str, start: datetime, end: datetime):
“””Execute query in chunks for large time range.”””
chunk_size = timedelta(days=self.chunk_threshold_days)
all_results = []
current_start = start
while current_start < end:
current_end = min(current_start + chunk_size, end)
chunk_result = self._execute_single_query(promql, current_start, current_end)
if chunk_result:
all_results.extend(chunk_result)
current_start = current_end
Zero-Shot Forecasting With TOTO
The agent’s intelligence comes from TOTO, a pre-trained transformer model that represents a paradigm shift in time-series forecasting. Unlike traditional models that require extensive training on domain-specific data, TOTO delivers highly accurate zero-shot predictions out of the box. This democratizes AI, allowing teams to get advanced forecasting without needing a data science team.
Traditional Models vs. TOTO
TOTO generates probabilistic forecasts, providing not just a single prediction but a range of likely outcomes with confidence intervals (e.g., p10, p50, p90 quantiles).
{
“metric”: {
“__name__”: “cost_usd_per_cluster_forecast”,
“clusterName”: “aws-ramesses-regional-0”,
“node”: “cluster-aggregate”,
“quantile”: “0.10”,
“horizon”: “14d”
},
“values”: [10.5, 11.2, 9.8],
“timestamps”: [1640995200000, 1640998800000, 1641002400000]
}
{
“metric”: {
“__name__”: “cost_usd_per_cluster_forecast”,
“clusterName”: “aws-ramesses-regional-0”,
“node”: “cluster-aggregate”,
“quantile”: “0.50”,
“horizon”: “14d”
},
“values”: [13.5, 13.2, 13.8],
“timestamps”: [1640995200000, 1640998800000, 1641002400000]
}
{
“metric”: {
“__name__”: “cost_usd_per_cluster_forecast”,
“clusterName”: “aws-ramesses-regional-0”,
“node”: “cluster-aggregate”,
“quantile”: “0.90”,
“horizon”: “14d”
},
“values”: [17.5, 16.2, 15.8],
“timestamps”: [1640995200000, 1640998800000, 1641002400000]
}
From Insights to Actionable Savings
While forecasting provides visibility into future costs, the true value of a FinOps Agent lies in its intelligent recommendation engine which transforms predictions into actionable cost-saving opportunities. It makes data-driven decisions that can save thousands of dollars across your multi-cluster infrastructure.
The core of the recommendation engine is the IdleCapacityOptimizer.
class IdleCapacityOptimizer:
def __init__(self, config: Dict[str, Any] | None = None):
cfg = config or {}
self.idle_cpu_th = float(cfg.get(“idle_cpu_threshold”, 0.30))
self.idle_mem_th = float(cfg.get(“idle_mem_threshold”, 0.30))
self.min_node_savings = int(cfg.get(“min_node_savings”, 1))
def optimise(self, forecast_dict: Dict[str, Any]) -> List[Dict[str, Any]]:
# Analyze each cluster for optimization opportunities
# Return actionable recommendations with dollar-amount savings
How it Works
- Multi-Metric Analysis: Combines CPU, memory and cost forecasts to identify truly idle nodes
- Threshold-Based Detection: Configurable thresholds (30% idle CPU/memory) prevent false positives
- Forecast-Aware Decisions: Uses predicted future utilization, not just historical data
- Cost-Benefit Calculation: Estimates actual dollar savings over the forecast horizon
When the agent spots idle capacity, it outputs a clear, actionable recommendation. Here’s what you’d see.
{
“status”: “success”,
“recommendations”: [
{
“cluster”: “aws-ramesses-regional-0”,
“type”: “idle_capacity”,
“nodes_to_remove”: “aws-ramesses-regional-0-md-8snzm-9shzt”,
“forecast_horizon_days”: 7,
“estimated_savings_usd”: 7.82,
“message”: “Over the 7-day forecast, removing node ‘aws-ramesses-regional-0-md-8snzm-9shzt’ could save approximately $7.82.”
}
],
“generated_at”: “2025-01-18T10:21:16.642907”
}
This can be parsed and visualized in Grafana, sent to finance or integrated into automation platforms. But what does it mean?
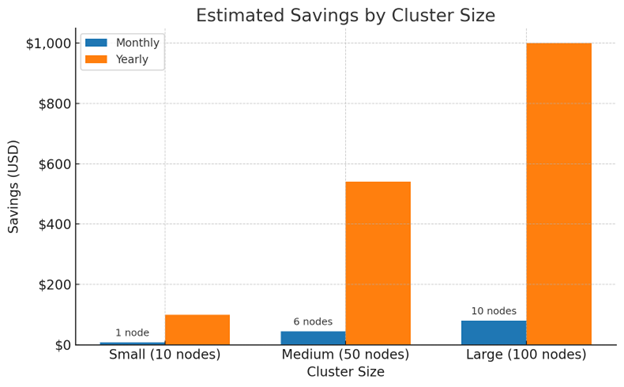
In the above JSON, the agent found that one node stays mostly idle. Shutting it down would save ~$8 over the next seven days. For a small team, this may sound minor, but in reality:
- It’s a 20% cost reduction for that node.
- Freed resources can be used for development/testing elsewhere, without hurting reliability.
Validation & Trust
FinOps Agent includes built-in validation that runs every few forecast cycles.
It validates forecasts regularly:
- Walk‑forward backtesting with mean ± stdev of error
- Accuracy metrics tailored to cost and utilization
Results are exposed via/stats so operators and finance teams can see the quality alongside the forecasts.
def validate_forecasts(self, raw_prometheus_data):
# Split historical data into train/test sets
train_ratio = 0.7 # 70% training, 30% testing
# Generate forecasts on training data
# Compare with actual values in test set
# Calculate accuracy metrics:
# – MAPE (Mean Absolute Percentage Error)
# – MAE (Mean Absolute Error)
# – RMSE (Root Mean Square Error)
Here’s an example of validation stats from a production cluster:
- MAPE: 2.9% (excellent accuracy)
- No clusters with errors
- Multiple cost and utilization metrics validated
An output JSON generated by FinOps Agent:
{
“status”: “success”,
“timestamp”: “2025-07-18T12:41:48.686914”,
“validation_results”: {
“aws-ramesses-regional-0”: {
“cost_usd_per_cluster_cluster-aggregate”: {
“mae”: 0.0006218099733814597,
“mape”: 0.27760169468820095,
“rmse”: 0.0006950463284738362
},
“cpu_pct_per_cluster_cluster-aggregate”: {
“mae”: 3.592783212661743,
“mape”: 4.132195591926575,
“rmse”: 3.7026379108428955
},
…..
“cpu_total_cores_per_node_aws-ramesses-regional-0-md-8snzm-stgb6”: {
“mae”: 0.01127923745661974,
“mape”: 0.563961872830987,
“rmse”: 0.011976901441812515
}
}
},
“summary”: {
“cluster_count”: 1,
“clusters_with_errors”: 0,
“metrics_validated”: 21,
“average_mape”: 2.9
},
“validation_config”: {
“train_ratio”: 0.7,
“metrics”: [
“mape”,
“mae”,
“rmse”
],
“format”: “toto”
}
}
Output & Storage
The FinOps Agent exposes forecasts through a RESTful HTTP API, making integration with existing tooling straightforward.
# Get cluster-specific forecasts
GET /metrics/{cluster_name}
# List all available clusters
GET /clusters
# Retrieve optimization recommendations
GET /optimize
# Access validation statistics
GET /stats
Grafana Integration
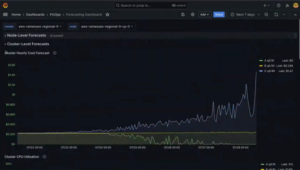
For visualization, the agent includes pre-configured Helm charts that deploy custom Grafana dashboards with Infinity Datasource integration.
How to Try
The recommended way is to install a FinOps Agent using the MultiClusterService resource in k0rdent.
Follow the instructions in the README section to get started with the FinOps Agent: https://github.com/Mirantis/finops-agent?tab=readme-ov-file#k0rdent–kof-recommended.
Deploying the FinOps Agent across your clusters is simple thanks to k0rdent’s MultiClusterService resource. Here’s an example YAML:
kind: MultiClusterService
metadata:
name: forecasting-agent
spec:
clusterSelector:
matchLabels:
group: production
serviceSpec:
services:
– template: forecasting-agent-0-1-0
name: forecasting-agent
namespace: finops
The FinOps Agent’s integration with KOF provides seamless observability insights, including pre-built Grafana dashboards.
# Create custom GrafanaDashboard objects
apiVersion: grafana.grafana.com/v1beta1
kind: GrafanaDashboard
metadata:
name: finops-forecasting
namespace: monitoring
spec:
json: |
{
“title”: “FinOps Forecasting Dashboard”,
“panels”: […]
}
Start Building Today
The FinOps Agent demonstrates how quick and effective it is to address real business challenges when building on the right foundation. With k0rdent and KOF’s standardized platform, you can:
- Focus on business outcomes, not infrastructure headaches
- Deploy FinOps and other custom solutions across all clusters with ease
- Seamlessly integrate insights into existing tools and workflows
- Effortlessly scale as needed
Ready to get started? Deploy the FinOps Agent as your launchpad, then start reporting metrics, take action and realize measurable cost savings.


