
New Relic Deepens Support for Kubernetes
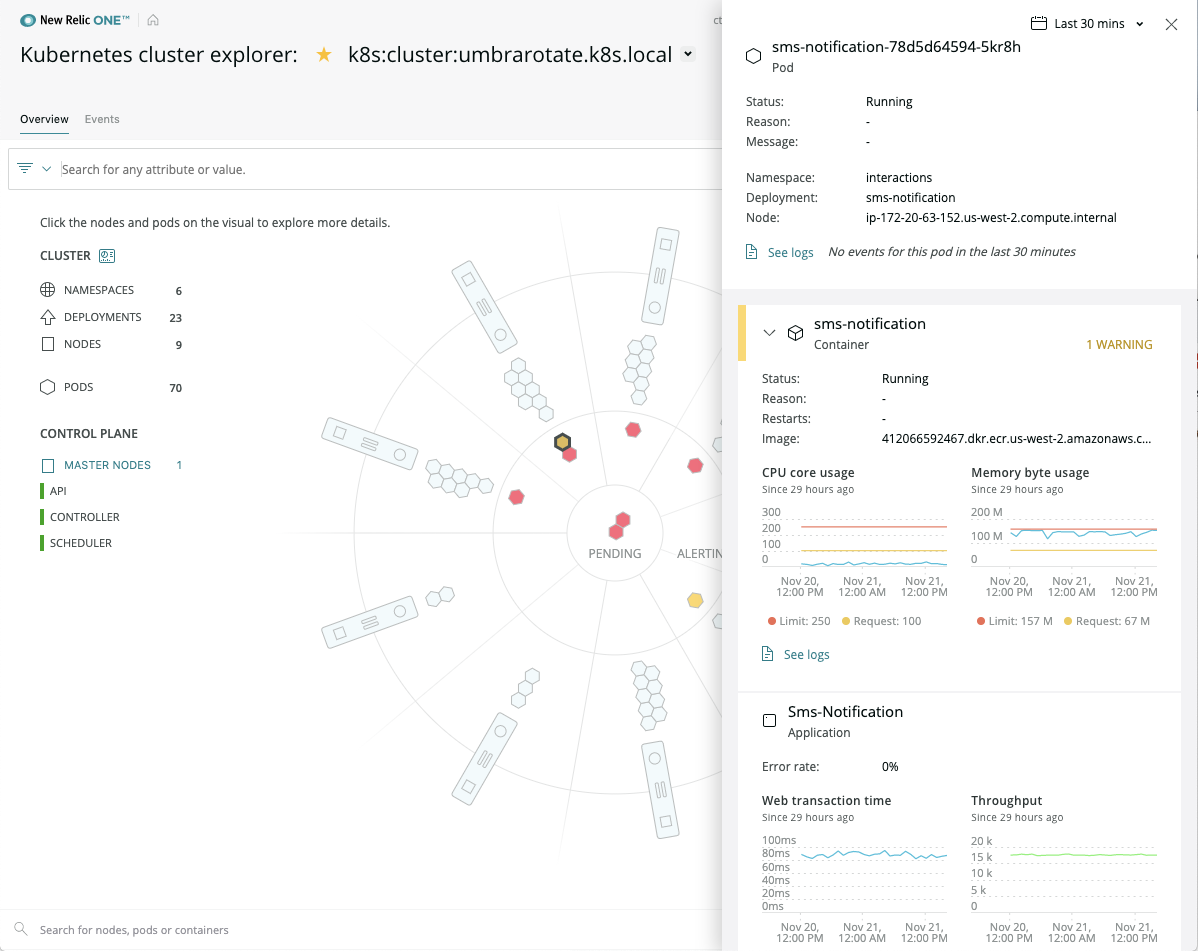
New Relic at the KubeCon + CloudNativeCon 2019 conference this week extended its support for Kubernetes by providing support for Kubernetes Events as well as a tool that creates a multi-dimensional representation of a Kubernetes cluster through which IT teams can drill down into Kubernetes data and metadata.
As part of a larger open instrumentation initiative the company launched earlier this year, New Relic also announced it has integrated its namesake observability platform with Prometheus, an open source tool from the Cloud Native Computing Foundation (CNCF) that monitors Kubernetes environments, and extended New Relic Traces to capture tracing data generated by either Istio, an open source service mesh or OpenCensus, an open source tool for collecting metrics and telemetry.

 New Relic also now supports Java exporters that can send data directly to the company using the public application programming interfaces for metrics, events, logs and traces instead of installing agent software. In addition, it added support for Fluent Bit, an open source log processor and forwarder, to make it possible to route container logs from, for example, AWS Fargate. New Relic also announced integrations with Google Cloud Anthos and Cloud Run, a set of Kubernetes-based services provided by Google.
Nadya Duke Boone, general manager and vice president of product management at New Relic, says IT teams can use New Relic tools to inspect a single container or explore an entire cluster. Support for Kubernetes Events will provide contextual information about pods, nodes, stateful sets and deployment issues to enable IT teams to troubleshoot issues faster. Kubernetes events also provide deployment information to correlate infrastructure changes against application metrics.
While there is no shortage of tools for managing Kubernetes environments, Boone notes that open source tools are typically not as accessible as New Relic’s. In addition, the New Relic platform is designed to capture both infrastructure and application data to make it easier to correlate what’s occurring across the entire Kubernetes environment.
New Relic is already widely employed to monitor legacy monolithic applications. As IT organizations embrace Kubernetes, Boone notes many of those organizations want to be able to extend the reach of New Relic to include Kubernetes clusters that are being deployed alongside legacy applications. In many cases, applications running on Kubernetes clusters are consuming application programming interfaces (APIs) exposed by monolithic applications, which means that IT organizations need a more holistic approach to monitor and manage, adds Boone.
Boone says savvy IT organizations are providing developers with visibility into New Relic so they can monitor the performance of their applications on their own. That approach has the added benefit of reducing the number of tickets those developers might generate whenever there is a performance issue, because they can easily discover the source of a problem involving the code they wrote.
Microservices-based applications are generally complex, so they require IT organizations to deploy some type of observability platform. The issue now is determining to whether they want to rely on open source tools designed for Kubernetes or embrace a platform to monitor Kubernetes alongside all their other applications and systems.
