
The Future of Observability
At KubeCon + CloudNativeCon in Barcelona two years ago, I gave a keynote with Frederic Branczyk called Metrics, Logs & Traces: What Does the Future Hold for Observability?
We offered three predictions, the first of which was that we would start seeing more and more correlation between the three pillars of observability: logs, metrics and traces.

This was the initial model, sketched out several years ago.
Three Pillars of Observability
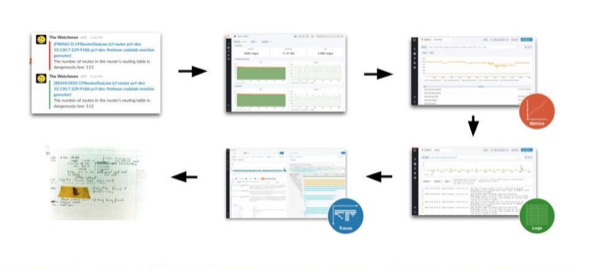
This model was relatively linear and one-dimensional, going from metrics to logs to traces. But in real life, you often have to switch back and forth between metrics and logs, for instance.
So over the last couple of years, we’ve been evolving this model, and I’m happy to say that we’ve made good on our prediction of more and more correlation.
Leveraging the open source projects Grafana (for visualization), Grafana Loki (for logging), Grafana Tempo (for tracing) and Prometheus (for metrics), our stack now allows you to combine metrics and logs and traces in Grafana dashboards for a single debugging or incident response experience.
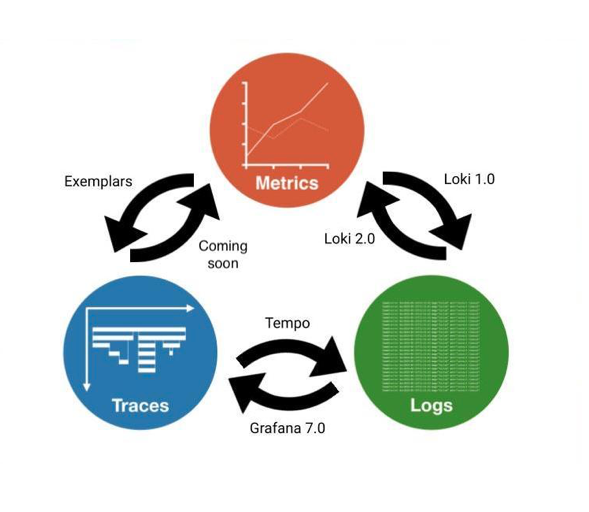
LGTM means, of course, “looks good to me.” But at Grafana Labs, it also stands for logs, Grafana, traces and metrics. This is the new model of our vision for correlation, which shows more movement between the three pillars, and in both directions. I’ll walk you through the developments we’ve made to get here.
Metrics to Logs and Logs to Metrics
We launched Loki in 2018, and starting with v1.0, you can find your relevant logs from your metrics quickly, easily and automatically. The logs are systematically and consistently labeled in the same way as Prometheus metrics, which guarantees that you can always find them and that this always works.
Last October, the Loki v2.0 release brought many improvements to LogQL, the Loki query language that’s inspired by PromQL, the Prometheus query language. LogQL now allows you to extract metrics from your logs, which can be particularly useful if you have legacy applications that either aren’t instrumented or don’t expose metrics themselves.
For instance, you can generate ad hoc metrics directly from NGINX logs in real time and visualize them in Grafana, as demonstrated in this video:
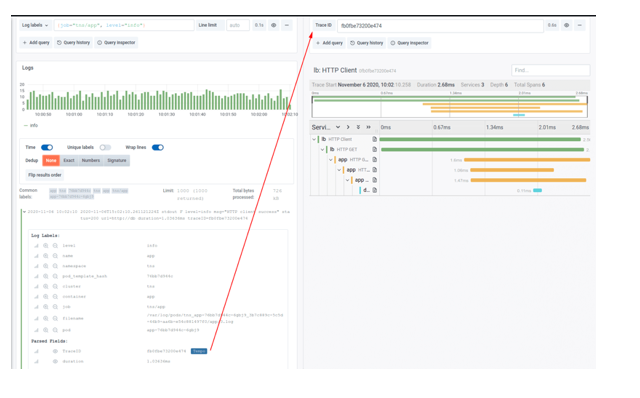
Logs to Traces
Full native support for trace data was built into Grafana 7.0 to enable a seamless and unified experience that connects and visualizes metrics, logs, and traces. And as of Loki 2.0, if any log contains an identifier for a trace, you can click on it and jump directly to that trace in Tempo.
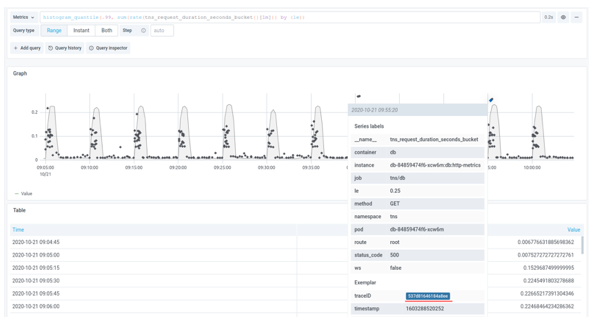
Metrics to Traces
As of Grafana 7.4, you can use exemplars to go directly from metrics to traces without detouring through logs. Exemplars allow you to see a sampled subset of the requests on a graph, so that all those dots represent individual traces, and you can then click on them and jump straight to the trace.
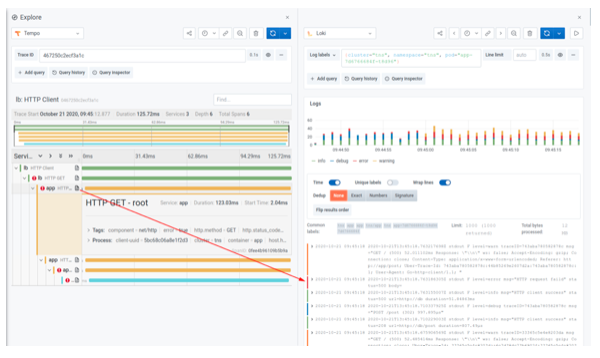
Traces to Logs
To link from a trace back into logs, the Grafana Agent allows you to decorate your traces, logs and metrics with consistent metadata, which then creates correlations that were not previously possible. After jumping from an exemplar to a trace, you can now go directly to the logs for the struggling service. The trace immediately identifies what element of your request path caused the error, and the logs help you identify why.
Observability This Year and Beyond
As you can see, we’ve already built out a great deal of this model; our plan is to develop a lot more of these kinds of transitions, to add more aspects and join them up in more interesting ways. Up to now, LGTM has been specific to Prometheus, Loki and Tempo. This year and beyond, we’re working on making these workflows more accessible, easier to use, and available to other tools as well — with Grafana bringing them all together.
We’re looking forward to joining the open source community at KubeCon + CloudNativeCon EU this May, to share our LGTM vision and hear your thoughts.
