
The Power of Asking Questions: Container Scaling and Observability
I always tell people, “Observability is not logs, metrics and traces! Observability is empowering your team to ask questions.” That’s very aspirational and sounds good, but it’s not at all clear. I now have a self-contained story that perfectly explains it.
Benchmarking Container Scaling on AWS
I vacillate wildly on the engineer/manager pendulum and part of my work involves architecting high-scale systems that can handle spiky loads. Containers scale in unexpected ways, and to build the best solution possible, I have to know how containers scale. Is Amazon’s Elastic Container Service (ECS) faster than Amazon’s Elastic Kubernetes Service (EKS)? Do we have to stress about operating systems and security patches and maintenance with EC2 servers if we want the best performance, or are serverless containers fast enough?

To figure all this out, in 2020 I tested how fast containers scaled on AWS. The next year, I got a preview from AWS so I could test some speed improvements before they were released, and I presented the results of testing how much faster containers scale in 2021 at re:Invent. The cloud moves fast, and 2021’s results were very different from what we got in 2020.
This year, in 2022, I was eager to see what changed and I benchmarked things again. You can read the whole benchmark and see the full results on my blog, but in this story, we will focus on how Honeycomb allowed me to get the best results!
This year’s tests are a lot more comprehensive, and, for our story, they also include ECS on Fargate Windows. ECS on Fargate supporting Windows containers is a relatively new feature, launched in late 2021. A lot of people would dismiss this, but it’s major news for anybody doing Windows on AWS: They can now move way faster, with way less stress.
For this exact reason, I knew I had to benchmark ECS on Fargate Windows this year.
Our test application is a small hello-world Python web app using the Flask micro-framework, packaged in a container and stored using AWS’ Elastic Container Registry (ECR). There are many ways to optimize container images, many ways to optimize container startup and so on—I did not want to get into all that. These benchmarks are meant to give a frame of reference for how fast containers can scale, not to showcase the best possible performance.
To measure how fast containers scale, the application records the exact time it started. The timestamp and whatever other metadata that’s easily available are packaged into a nice JSON file. For ECS on Fargate, it looks something like this:
{
“message”: null,
“seconds_since_epoch”: 1640266782, # the timestamp
“aws_region”: “us-east-1”,
“aws_az”: “us-east-1f”,
“python_system”: “Linux”,
“python_node”: “ip-172-19-130-197.ec2.internal”,
“python_release”: “4.14.252-195.483.amzn2.x86_64”,
“python_version”: “#1 SMP Mon Nov 1 20:58:46 UTC 2021”,
“python_machine”: “x86_64”,
“orchestartor”: “ecs”,
“ecs_service_count”: “5”,
“runner”: “fargate”,
“aws_purchase_type”: “spot”,
“app_version”: “241ac4b1c44fce7e1754b587a6c589204a7be92a”,
“image_pull_started_at”: “2021-12-23T13:38:59.794230769Z”,
“image_pull_stopped_at”: “2021-12-23T13:39:33.545431167Z”,
“container_id”: “0023a9c5259f4b1e80eccbb727fa55c7-527074092”,
“container_arn”: “arn:aws:ecs:us-east-1:000000000000:container/ecs-on-fargate/0023a9c5259f4b1e80eccbb727fa55c7/afe21e7f-0ec8-402c-a68e-4d9b3ff88a7d”,
“container_created_at”: “2021-12-23T13:39:41.778967284Z”,
“container_started_at”: “2021-12-23T13:39:41.778967284Z”,
“container_image_sha”: “sha256:f0ae80aec3e4b7ccfc92a8ce48626d767afe66b26634f9742c598cf9be1db5ca”,
“cluster”: “arn:aws:ecs:us-east-1:000000000000:cluster/ecs-on-fargate”,
“task_id”: “arn:aws:ecs:us-east-1:000000000000:task/ecs-on-fargate/0023a9c5259f4b1e80eccbb727fa55c7”,
“container_clock_error_bound”: 0.43166950000000004,
“container_reference_timestamp”: “2021-12-23T13:39:33Z”,
“container_clock_synchronization_status”: “SYNCHRONIZED”
}
I knew I had to send this data to CloudWatch Logs and, since logging frameworks have retries and backoffs included, this will be our definitive source of truth. But logs are sometimes delayed; they are not pretty—and, at thousands of log lines, they are definitely not easy to understand. I was already a huge fan of Honeycomb, so I decided to also send the JSON event to Honeycomb for a live view of how containers are scaling. Honeycomb bills based on events sent—not per-CPU or per-container—so this won’t have a ridiculous cost. Our test app will send the JSON asynchronously to CloudWatch Logs and synchronously to Honeycomb.
With the application done, I started testing it. After a couple of tweaks, I managed to get it to successfully run in a Windows container and I performed the benchmark:

Figure 1: Hand-drawn-style graph showing the scaling performance from 0 to 3200 containers. ECS on Fargate using Linux starts around the 30-second mark and reaches 3200 containers just before the four-minute mark. ECS on Fargate Windows starts around the nine-minute mark and reaches 3200 containers just before the 15-minute mark.
The results were in line with what I expected: Windows was a bit slower than Linux, but then they scaled up just as fast. There’s extra licensing stuff that has to happen for Windows and the container images are bigger, so it is reasonable that ECS on Fargate Windows would be delayed. A 10-ish minute delay is in the expected range—I was chatting with other developers and with some AWS engineers and we all went “OK, that makes sense.”
Without proper observability, this is where I would’ve stopped.
Being Curious: Investigating Scaling Performance
One evening, I realized the data I was sending to Honeycomb had two interesting fields: image_pull_started_at and image_pull_stopped_at. If I subtracted the latter from the former, I could figure out how long the image download takes. The time spent downloading the container image has a big impact on scaling, so this would be interesting to see. Even more, I was launching tens of thousands of containers which meant I could take a peek at how AWS’ Elastic Container Registry performs over time.
The nerdy part of me got curious. I desperately wanted to see this, but how could I get that data?
I had all the JSONs archived in CloudWatch Logs and in S3 and I could write up a small script that would calculate the image-pulling time. But that would mean writing code, stress and it would take too long. I was curious, but not that curious! I really did not want to have to re-send all the events with an extra image_pull_duration field added.
Honeycomb to the rescue! Honeycomb has a cool feature called derived columns, which does exactly what we need: It extends the data for each event. I quickly checked the docs and I saw there was even an UNIX_TIMESTAMP() function that can work on dates. This whole idea might be something we could do in seconds.
Still, being traumatized by other “observability providers,” I started to worry. Would derived columns cost me? Do derived columns only work for brand-new data? After all, we’re trying to avoid re-sending the data.
Of course not! Derived columns don’t cost a thing and they work on all the data. I could actually get my curiosity satisfied! I went and configured a derived column—with the helpful preview, it took me less than a minute to figure out the syntax! UNIX_TIMESTAMP() to convert the dates to a number (epochs) and then SUB() to subtract image_pull_started_at from image_pull_stopped_at thus getting the image_pull_duration:

Figure 2: Configuring the derived column in the Honeycomb UI.
With this extra column added, we can have some fun! I ran a scaling test using ECS on Fargate Spot with Linux containers, scaling from five to 10,000 containers. That whole thing took 10 minutes, and Honeycomb shows me exactly how many containers started each second:

Figure 3: Graph showing 9, 994 containers launched over 10 minutes, with about 20 containers launched each second
But we’re here for image pulling speed, so let’s look at that:
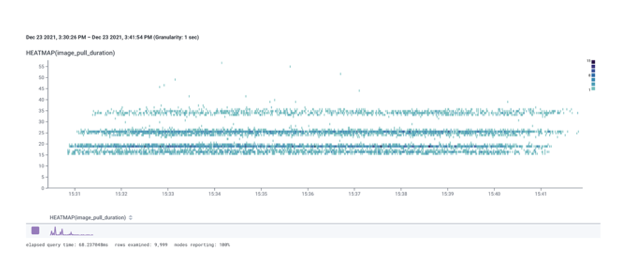
Figure 4: Heatmap graph in Honeycomb showing four clusters: one at 15-ish seconds, one at 20-ish seconds, one at 25-ish seconds and one at 35-ish seconds.
Even better, let’s break it down by availability zone (AZ):
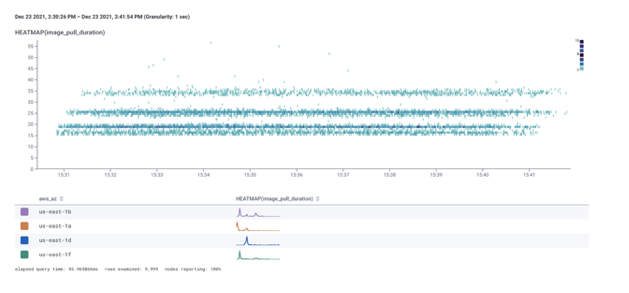
Figure 5: The previous heatmap graph in Honeycomb, with a per-availability-zone breakdown
If we hover over each AZ, we can see the exact performance for each AZ:
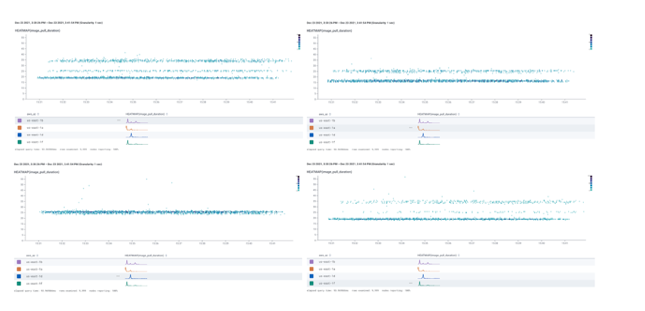
Figure 6: Four heatmap graphs in Honeycomb showing performance in each AZ. The first AZ has three clusters, the second AZ has two clusters, the third AZ has a single cluster and the fourth has two clusters and a bunch of scattered points.
Iiiinteresting! I am seeing some curious behavior depending on the availability zone.
Honeycomb doesn’t have a per-query charge or anything like that. I could ask as many questions as I wanted and check out as much data as my heart desired!
Curious to see data from the very first test that I ran a couple weeks ago? Click “Run query.”
Curious to see if there’s a correlation between things? I can break down by all the fields and ask as many questions as I want. Or I can use Honeycomb’s BubbleUp feature, which tries to figure that out for me.
Curious about ARM versus Intel performance? A breakdown of Kubernetes events to see if there’s an increase in errors when scaling up? It’s all a query away!
I was having a lot of fun, and I even shared fun stats on Twitter. Folks came up with their own ideas and curiosities, and we figured out together that, for example, for a specific test on a specific day, use1-az6 was the fastest with a P99 of 26 seconds and use1-az1 and use1-az5 were both “slow” with a P99 of about 35 seconds. But that was only on a specific day.
I was having a lot of fun asking questions and learning more about these systems when something caught my eye—Windows was way slower than Linux:
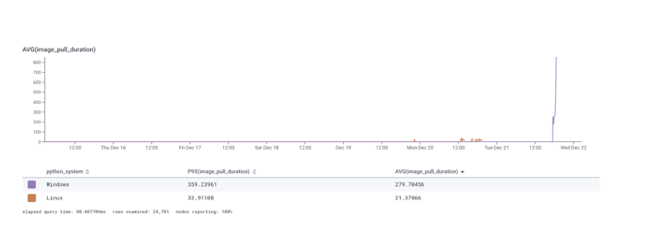
Figure 7: Honeycomb graph showing the average image pull duration for Windows and Linux.
Downloading the container image for Linux took, on average, 21 seconds, with 95% of images downloading in less than 33 seconds. Downloading the Windows version of the container image took an average of 280 seconds, with a P95 of 360 seconds! That’s half a minute for Linux and six full minutes for Windows.
This got even weirder when I looked at the image sizes in the AWS Console—the Linux image was 380 MBs and the Windows image was 76 MBs:
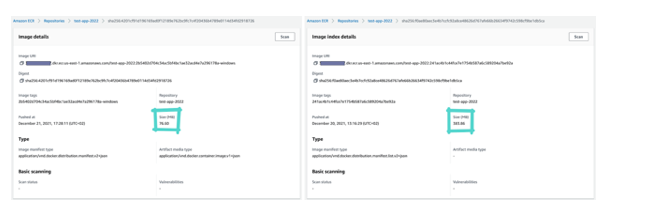
Figure 8: Screenshot of the AWS Console showing the container image sizes in the AWS Elastic Container Registry.
What’s happening here? Why is downloading the Windows image taking so long?
Performance Optimization for Windows Container Images
As it turns out, Windows container images are more complex.
The base Windows container images have complex licensing requirements and they are non-distributable artifacts. That means that the base image is not actually part of our container image and that’s why we see the Windows image being only 76 MBs—those are only our dependencies and our code. The Windows base image is an additional 2.7GBs that is a non-distributable artifact.
For our Python web app running on Windows, the image download will get 76MBs from AWS’ ECR, but the base Windows Server image of about 2.7 GBs will be downloaded from Microsoft. It ends up looking somewhat like this:
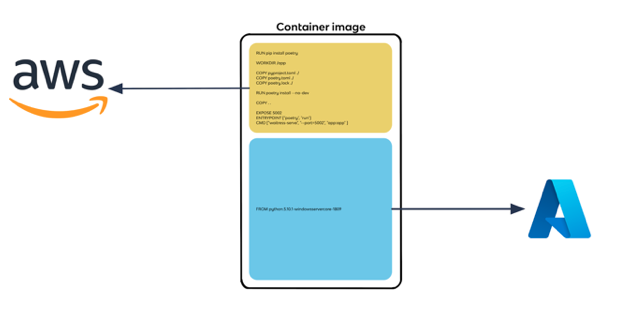
Figure 9: Diagram showing the Dockerfile for our test application, with the “FROM” line pointing to Azure and the rest of the Dockerfile pointing to AWS.
Well, that is not really true. We are running in AWS and pulling an image from AWS’ own container registry is easier. Azure is far away across the internet. If there is any disturbance on the way from AWS to Azure, we’ll see it reflected in our download speeds. The process ends up looking more like this:
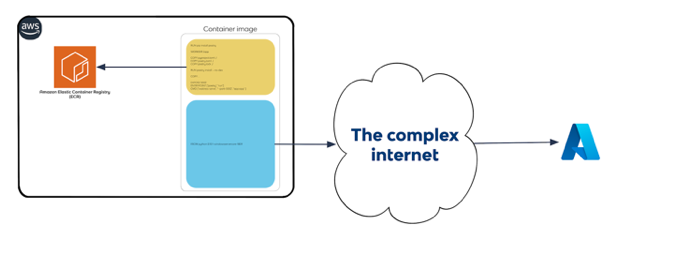
Figure 10: Larger diagram showing the Dockerfile for our test with most of the lines still pointing to AWS, but with the “FROM” line having an arrow to a nebulous “The complex internet” and then to Azure.
As per Steve Lasker, PM architect, Microsoft Azure, Microsoft recognizes this licensing constraint has caused frustration and is working to remove this constraint and default configuration. Until then, for the highest consistent performance, both AWS and Microsoft recommend setting a Docker daemon flag for private-use images: — allow-nondistributable-artifacts. By setting this flag, the full image totaling 2.8 GBs will be pushed to ECR—both the base image and our application code. When ECS on Fargate will have to download the container image, it will download the whole thing from close-by ECR.
With this knowledge, I quickly went and edited my GitHub Actions workflow to set that flag:
– name: Login to ECR Private
…
– name: Tune Docker for Windows container images
run: |
# Create or update the Docker daemon config
$config = @{}\
if (Test-Path C:\ProgramData\docker\config\daemon.json) {
$config = (Get-Content C:\ProgramData\docker\config\daemon.json | ConvertFrom-json)
}
$config[“allow-nondistributable-artifacts”] = @(“${{ env.AWS_ECR_PRIVATE_ACCOUNT_ID }}.dkr.ecr.${{ env.AWS_ECR_PRIVATE_REGION }}.amazonaws.com”)
ConvertTo-json $config | Out-File -Encoding ASCII C:\ProgramData\docker\config\daemon.json
Restart-Service docker
– name: Build and push to AWS ECR Private
…
I built and pushed a new image, and performance improved massively: The initial delay went down from 10 minutes to five minutes:
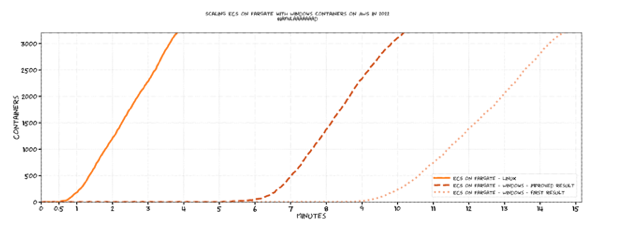
Figure 11: Updated version of the previous hand-drawn graph showing the scaling performance from 0 to 3,200 containers. ECS on Fargate using Linux starts around the 30-second mark and reaches 3,200 containers just before the four-minute mark. ECS on Fargate Windows starts around the nine-minute mark and reaches 3,200 containers just before the 15-minute mark. The new ECS on Fargate using Windows with improved image pulling starts scaling before the six-minute mark and reaches 3,200 containers just after the 10-minute mark.
That’s a huge acceleration that resulted because I was bored and I asked questions.
Of course, when I re-tested a couple of days later, the internet between AWS and Azure was feeling better and there was no difference in performance! Still, with the image in ECR, I get guaranteed performance regardless of how the internet feels.
This is Observability
Observability is exactly this: The power of asking your systems questions!
It’s not logs, metrics and traces scattered across different products and UIs or even under a single plane of glass. Observability is allowing engineers to be curious and to ask questions. Just like I did here, your engineers will ask questions, learn about their systems, and make them better in the process! I’ve seen this happen again and again, with all my customers: Empowered engineers can move mountains!
Before I leave you, there is one more thing I have to say: I did all this using a personal account that is taking advantage of Honeycomb’s generous free tier. For $0 per month, I can send 20 million events to Honeycomb and I ask as many questions as I want. You can do the same—today, for free!
Go ask your systems questions and let us know what you discover!
Join us for KubeCon + CloudNativeCon Europe 2022 in Valencia, Spain (and virtual) from May 16-20—the first in-person European event in three years!
