Why CPU-Based Autoscaling Fails for Rails — and What We Used Instead

TL;DR — Key Takeaways
- CPU and memory can be lagging indicators for synchronous web services because users may already be waiting before infrastructure utilization rises.
- For request-serving workloads, queue latency is often the better scaling signal because it measures how long requests wait for an available worker.
- Background workers are different: queue depth is the more useful signal because the goal is controlling backlog rather than immediate user wait time.
- KEDA can scale from external metrics while fallback replica settings provide protection if the monitoring system becomes unavailable.
- Helm charts can make safe defaults universal across 100+ services by embedding probes, PDBs, autoscaling, progressive delivery, ownership labels and graceful shutdown behavior.
Most ‘scale on the queue’ advice is about background jobs: How many messages are waiting. For synchronous web traffic, the signal that protects users is different: How long each request waits for a worker. Lessons from a Helm platform running 100+ services.
The Problem Nobody Talks About
Every Kubernetes tutorial shows you how to deploy one app. Nobody shows you what happens when you have 100+ services, five languages, three deployment strategies and an engineering org that doesn’t want to think about the infrastructure.

When I started, every team wrote their own deployment configs — hand-written YAML, copy-pasted from the last service, drifting apart with every PR. One Rails app had liveness probes; another didn’t. One used HPA on CPU; another a static replica count. Nobody had Pod Disruption Budgets.
We didn’t need a PaaS or a portal — just well-designed Helm charts that encode how services should run and make the safe path the easy path. Here’s the one decision that mattered the most.
One distinction up front, because it’s the crux of everything below. Scaling background workloads on queue depth — the number of messages waiting — is well-trodden ground; it’s what most KEDA tutorials show. But a synchronous web tier has no backlog to count. Its equivalent signal is queue latency: The time a request waits for a free worker. Depth asks “How much work is piled up?”; latency asks “How long is a user already waiting?” For a request-serving app, the second question maps directly to errors — and it’s the one CPU and memory answer far too late.
Memory and CPU Are Lagging Indicators
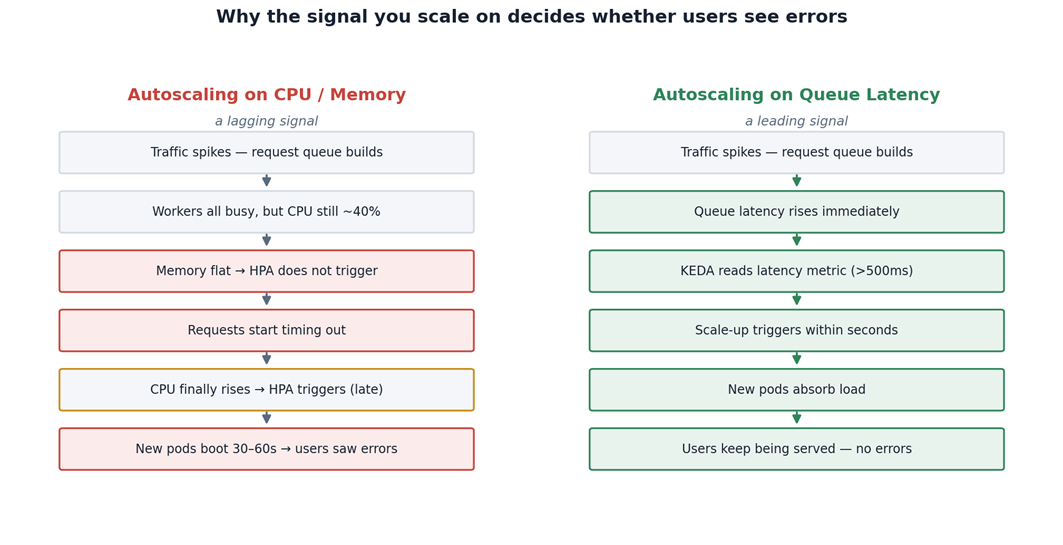
Our main Rails monolith is a Unicorn-based app handling heavy daily traffic. It autoscaled on memory. When traffic spiked, here’s what happened:
- The request queue builds up — users are waiting.
- Unicorn workers are all busy, but CPU might only be at 40%.
- Memory hasn’t moved, so the HPA doesn’t trigger.
- Requests start timing out.
- CPU finally rises and the HPA triggers — too late.
- New pods take 30–60 seconds to boot Rails.
- Users have already seen errors.
The lesson generalizes beyond Rails: CPU and memory are infrastructure signals, not application signals. By the time they move, your users are already suffering.
Autoscale on the Signal That Leads
So, for the web tier, we scale on wait time, not a count. A busy app can serve high volume with zero wait. What we react to is the moment requests start queuing behind saturated workers — the exact moment users begin to feel it. If latency is near zero, you have capacity; if it’s rising, you need workers now, not when CPU catches up.
You can wire this up with whatever metrics stack you already run. KEDA supports Prometheus, Datadog and cloud-native triggers; the principle is identical regardless of source. Our stack happened to be Datadog, so the flow looked like this:
Emit queue latency from the app. Your server (Unicorn, Puma, Gunicorn) reports how long requests sit in the queue:
StatsD.distribution(
'custom.unicorn.queue_latency',
queue_time_ms,
tags: ["service:#{service_name}", "env:#{environment}"]
)
Expose it as an external metric, then point a KEDA ScaledObject at it with a target value — say, scale up when queue latency crosses 500ms. Crucially, include a fallback so a metrics outage doesn’t freeze scaling:
fallback:
failureThreshold: 3
replicas: 10 # safely overprovisioned beats stuck at minimum
If three consecutive metric fetches fail, KEDA scales to a safe replica count instead of doing nothing — wasteful during an outage, but far better than sitting at three replicas when you need 20.
The result: Scaling responds in seconds, and new pods spin up while existing capacity is still serving users — before errors start.
Background workers are the mirror image. Sidekiq is where queue depth is finally the right signal — an async job running a few seconds late is fine, so you care about backlog, not per-job wait. CPU is still useless; the fix is to scale on aggregated depth across the queues you care about (default, mailers, critical). Be deliberate about which signal each tier uses: Latency for the synchronous web path where users are blocked, depth for the async worker path where they aren’t. Reaching for depth on the web tier is the common mistake — by the time a pile-up is countable, requests have already been waiting.
Make Safe Deployments the Default, Not an Opt-In
Every deploy is a potential incident: A config change that breaks auth for some users, a leak that only shows under production traffic, pods killed before draining connections. Plain kubectl apply can’t protect you from any of these.
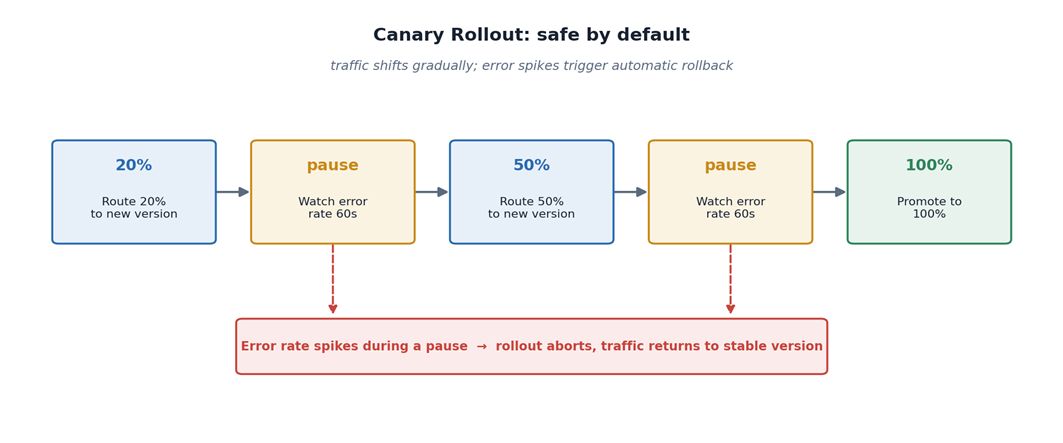
We made progressive delivery the default. For most web services, a canary steps traffic up — 20%, pause, 50%, pause, 100% — and aborts automatically if error rates spike during a pause. For services where partial routing isn’t safe, like payment processing, blue/green runs the new version alongside the old, checks error rates before switching and switches atomically. Tools such as Argo Rollouts and Flagger both do this well; the point is that if teams have to enable safety, they won’t. If it’s the default, every deploy is safer.
One hard-won detail: We hit persistent 504s during deploys because Kubernetes routed traffic to pods it was about to kill. A preStop hook fixed it:
lifecycle:
preStop:
exec:
command: ["/bin/sh", "-c", "sleep 15"]
That gives the load balancer 15s to drain before shutdown. We baked it into every chart, so no team discovers it the hard way.
Encode Ownership at Deploy Time
Every service deployed through our charts is observable automatically. The charts inject service, environment, version and team labels on every pod, registering it in our catalog with the right owner — so when an incident hits, on-call routing already knows who to page. We enforce it: A chart missing its responsible team and department fails the lint. Every pod carries a team label, so “Who owns this broken thing?” never requires a human to look it up.
What Scaled to 100+ Services
Make defaults safe, not minimal. Every chart ships with PDBs, probes and resource limits, so a team can deploy something that survives node failures and traffic spikes without knowing what any of those are.
Match the signal to the tier. Queue latency for the synchronous web path, queue depth for async workers, resource metrics for neither.
Template helpers are your API. They’re the contract between what a developer declares and what Kubernetes receives. When we changed our autoscaling approach, we updated the helpers — every service got it on its next deploy without touching its own config.
Build for the 2 a.m. scenario. Every default should be the thing you’d want when something breaks, and the person debugging has never seen the service before. PDBs, probes, labels, fallbacks — they’re all 2 a.m. features.
Infrastructure platforms aren’t really about technology choices; they’re about removing decisions. Every decision a developer doesn’t have to make is one they can’t get wrong — and at 100+ services, the decisions they don’t make matter more than the ones they do.
Frequently Asked Questions
When should teams use queue depth instead?
Queue depth is better suited to asynchronous workers such as Sidekiq, where jobs can wait without directly blocking a user request.
Why use a KEDA fallback replica count?
If the external metrics provider fails, a fallback allows KEDA to scale to a predetermined safe replica count rather than leaving the application stuck at minimum capacity.
What makes Helm charts useful across large Kubernetes platforms?
They let platform teams encode safe deployment and operational defaults once, then apply those standards consistently across many services without requiring every application team to understand the underlying infrastructure.