
Enabling Distributed Tracing for Microservices With Jaeger in Kubernetes
Distributed tracing is essential for root cause analysis to understand the issues, correlation and context of the requests communicating between microservices
Microservices are being adopted more in recent years across various domains, while monolith applications are being replaced with distributed system architectures, with various backend services communicating with each other across the network. Monitoring, tracing and observability vary from monolith to microservices, as the problems in microservices are different from monolith applications. This can become often complex and time-consuming to identify root causes when requests communicate across multiple services.

Problems With Tracing in Microservices
- Traditional tracing methods involve tracing following a request through a single application domain.
- Monolith to microservices tracing varies with complexity of services being distributed and ephemeral.
- Layers of complexity across application, infrastructure and orchestration engines added for development and troubleshooting.
- There can be many known and unknown issues in microservices environments, which makes it hard to anticipate.
- Increased debugging and troubleshooting costs.
- Data-silos and cross-team efforts required to troubleshoot issues in microservices.
- Varied tools are required to help organizations to manage the complexity of operating distributed application architecture for correlation and troubleshooting.
The below sections provide an overview of concepts and terms used in distributed tracing, framework/standards for distributed tracing, distributed tool architecture, tools used, installation and configuration of jaeger in Kubernetes, the steps to enable distributed tracing in an application deployed in Kubernetes and some of the considerations for enabling distributed tracing in production for microservices.
What Is Distributed Tracing and Observability?
Observability is a process through which a system’s internal states can be inferred from the knowledge of its external outputs, by means of incorporating telemetry, recording instrumentation.
Distributed Tracing is a technique to follow a single transaction, which often requires multiple component interactions downstream capturing timing and other metadata throughout the transaction, then reassemble information to provide a complete picture of the application’s behavior at runtime.
Why Distributed Tracing Is Required
Distributed tracing enables developers to perform:
- Distributed transaction monitoring.
- Troubleshooting and root cause analysis.
- Performance and latency optimization.
- Service dependency analysis.
- Identification of the quality and reliability of software.
- Distributed context propagation.
Frameworks/Libraries for Distributed Tracing
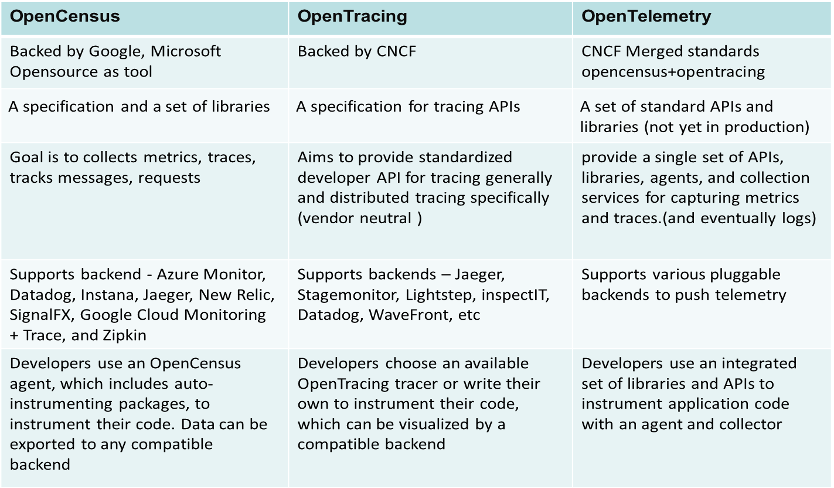
The following are major frameworks/standards used for distributed tracing, including a summary of what these frameworks provide:
Key Terms in Distributed Tracing
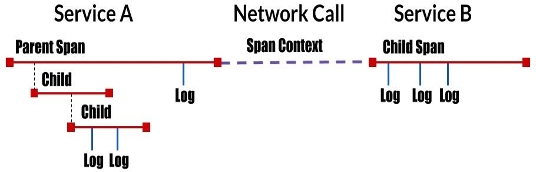
Span
- A span represents a logical unit of work in Jaeger that has an operation name, the start time of the operation and the duration. Spans may be nested and ordered to model causal relationships. The recommended solution is to annotate spans with tags or logs.
- Tags are used as attributes/metadata in spans.
- Logs are like a regular log statement—they contain a timestamp and some data, but are associated with the span from which it was logged.
Span Context
A set of trace identifiers injected into each request, which the next service will extract and use to propagate the trace.
Trace
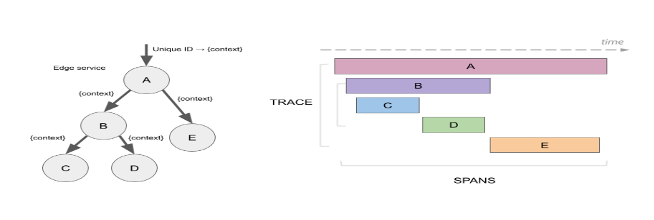
A trace is a data/execution path through the system and can be thought of as a directed acyclic graph (DAG) of spans. Below is a diagrammatic view of DAG. Each trace has a unique identifier (ex: a trace id) for the trace, as span context that is propagated over the network to the next request.
Baggage
Key-value pairs are added to the span context and propagated throughout the trace. An external process can inject baggage by setting the special HTTP Header jaeger-baggage on a request.
Distributed Tracing Architecture
Distributed tracing architecture (Fig. 1 below) has the following components to do tracing collection and visualization:
Application Code – Applications can use any of the tracing API and tracer client to start instrumenting the traces, span, context, tags and logs for every request call. The tracer client is a library/package that is packaged in the code.
Tracer Agent – This component is used for pushing the traces generated by the application tracer client.
Tracer Collector – This component is used to collect the traces pushed by the agent from each trace client (application). It can be used with an ingest queue such as Kafka to stream the traces to the collector in specific intervals or in batch.
Storage – The trace collector stores the traces in a database for further indexing and querying the traces.
API – This component is used to query the traces and span to display in the UI.
UI – The UI is a web interface to visualize and display the traces, span, context, tag and logs along with search and dependencies.

Tools for Distributed Tracing
There are three popular open source tools that can be used for distributed tracing in microservices:
- Zipkin
- Jaeger
- AppDash
There are many commercial SaaS-based tools available for distributed tracing. Most of the tools follow or adopt the above mentioned distributed tracing frameworks/standards.
Considerations for Enabling Distributed Tracing in Production
- Choose a tracer client that supports the programming languages used in the application and supports variety of back-end collectors and APIs that are neutral to the vendor on trace generation without having to refactor code.
- Choose supported back-ends: Tracing back ends contain a collector and storage components. Storage can be any database that supports indexing of traces, such as Cassandra or Elasticsearch.
- Tracing every request has overhead in terms of application and large volumes of data. Choose sampling strategy such as adaptive sampling or head-based and tail-based sampling to determine how the traces will be collected/stored. If a proxy or service mesh is used, the sampling can be defined at proxy/service mesh, which supports this.
- Deploy tracing agents as sidecars to abstract collector discovery from the client (ex: several back-end collectors required in multi-tenant scenario and each application sidecar agent to send to dedicated collector).
- Agents can also be run as daemon sets, in which multiple applications can send traces to a daemon set running in a single node, which in turn can send to a specific collector. This can be used in scenarios in which only a few services are available and all can send to the same collector with limited trace information.
- Scaling and monitoring of each tracing components are required in production.
- Follow the best practices of Go-Wide (produce end-to-end traces across all services) and Go-Deeper (produce traces that contain a deep, meaningful hierarchy of spans).
- Increase the logging level in the back-end components (agent, collector), as these components must be monitored and useful for troubleshooting, if traces are not generated/collected.
- Handle dependencies and readiness on back-end components (ex: collector depends on ES storage).
- Use persistent storage for ES/Cassandra.
- Secure trace communication between agent to collector with tls and secure endpoints and reverse proxy with AD. For UI security, define the appropriate role/role bindings for the components and use Jaeger auth token variables for agent to communicate to collector components.
Enabling Tracing for an Application
Enabling tracing for microservices, we have considered Jaeger as the back-end tool and open tracing API as the tracing client and jaeger agent.
Below are the steps needed for this:
- Jaeger infrastructure setup (installation and configuration of back-end components).
- Application-side instrumentation with tracer client enabled.
- Wiring application with Jaeger for communication between the agent and collector.
Jaeger Infrastructure Setup
Jaeger can be installed in Kubernetes as a docker container. The recommended option of installing Jaeger to Kubernetes is using Jaeger-Operator Helm chart, which can be found here:
![]() https://jaegertracing.github.io/helm-charts
https://jaegertracing.github.io/helm-charts
![]()
Jaeger Deployment Strategies
Jaeger can be installed with the below different strategies as defined in Jaeger installation guidelines.
- Allinone – This can be set when all the components of Jaeger are installed in a single image. This is primarily used for experimental, testing and demo purposes.
- Production – This is recommended for production, where each component must be highly available and scaled, and long-term storage is required (ex: Jaeger can be installed with Cassandra or Elasticsearch in Production strategy mode).
Note: Cassandra/Elasticsearch must be installed separately in the Kubernetes cluster.
Jaeger-Operator can install a self- provisioned Elasticsearch cluster in the same namespace if es.server-urls are not set and strategy is Production and storage type is Elasticsearch. Cleanup of indexes in schedule can be defined in the Jaeger storage-related configuration.
- Streaming – This is recommended for use in high-load situations, to reduce the pressure on back-end components and to capture real-time span information. It works along with production strategy by adding an ingestion streaming capability between collector and storage.

Jaeger Sampling Configurations
As mentioned earlier, while all traces are generated, only a few are sampled and marked for further processing and storage.
The following sampling techniques can be used with distributed tracing:
Head-based sampling – This is enabled by default in Jager. When a service receives a request call that contains no trace context, the Jaeger tracer will start a new trace, assign it with a random trace ID and make a sampling decision based on the currently configured sampling strategy. The sampling decision is made at the root of the call tree and propagated down the tree along with the trace context so that other services won’t make the sampling decision again.
Tail-based Sampling – This technique is used by most commercial tools, where 100% of spans are captured from the application but only stored in memory in a collection tier until the full trace is gathered, a sampling decision is made and sampled spans are stored to disk/storage while others are evicted from memory. This technique has a heavier performance penalty on the traced applications since 100% of traffic needs to be profiled by tracing instrumentation. This technique is useful to capture any unnoticed errors, unusual latencies, etc.
Adaptive Sampling – This technique enables defining of sampling decisions on per-operation, per-service basis. This is especially useful in services whose downstream endpoints may have very different traffic volumes and using a single probabilistic sampler for the whole service might starve (never sample) some of the low QPS endpoints. This enables users to define a lower bound rate limiter to ensure all endpoints are sampled with a certain minimal rate. Per-operation parameters can be configured statically or pulled periodically from the Jaeger back-end with the help of the Remote sampler option in Jaeger.
Sampling options can be defined at the client side or at the collector side. Jaeger libraries support different sampling options including constant, probabilistic, rate limiting and remote.
The Remote Sampler options can be defined in a JSON-based file for each service and per-operation, as given in the Jaeger documentation. This allows controlling the sampling strategies in the services from a central configuration in the Jaeger back-end and suitable in production scenarios.
Example :


Note: ratelimiting cannot be provided at the operation_strategies level.
In the above example, all ‘Order’ service-related operations are sampled probabilistically with a probability of 0.8 except addtocart and checkout, which are probabilistically sampled with a probability of 0.6 and 0.4 respectively. All operations for service deals are ratelimited at 5 traces per second. Any other service is probabilistically sampled with a probability of 0.5.
Once installation is complete, the Jaeger UI can be accessed with http://jaegeruiservice:nodeportIP/ or http://localhost:port, after kube port-forward. At this point, there will not be any traces shown in UI, as there are no traces in the storage.
Application-side Instrumentation
Add Tracing Client Library
For .net core applications, you can add the NuGet packages (Jaeger, OpenTracing.Contrib.NetCore) to the code. In the case of maven, a Jaeger-client package needs to be added in pom.xml.
Building a Span
Example:
![]()
Adding Tags
Example:

Adding Logs
Example:

Baggage
Example:
![]()
SpanContext and Injecting a Span
To pass along the trace information in calls so others can extract it you need to inject it into the carrier.
Example:

Span Start
Starting the span from the span builder will figure out if there is a parent for the span, create a context for the span and pass along all references and tags.
Example:
![]()
Connecting an Application With Jaeger Back-end
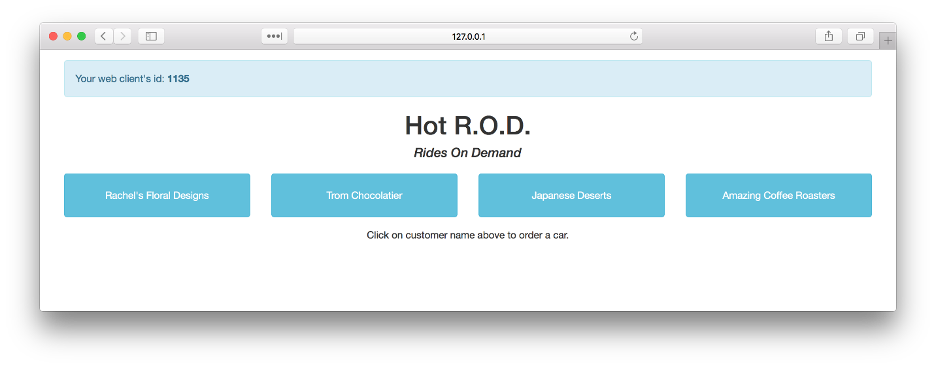
For illustration purposes, let us take a sample application Hot-rod-web, a Go-based application with Jaeger tracing built-in. The application source code can be found in the below link.
https://github.com/jaegertracing/jaeger/tree/master/examples/hotrod
- Build and deploy sample application to Kubernetes with Jaeger environment variables and Jaeger agent sidecar.
- The Jaeger agent can be deployed with sidecar, daemonset or statefulset and can be added manually or auto-injected based on the agent strategy.
Injecting Jaeger Agent Sidecar
Annotation sidecar.jaegertracing.io/inject=true can be added to the deployment or namespace level, based on which the Jaeger operator can auto-inject Jaeger Agent sidecars to the pods.
Auto-injection of Jaeger Agent sidecar adds the Jaeger environment variables to the application containers. If the agent strategy is daemonset, then the user must add the Jaeger agent and environment variables manually.
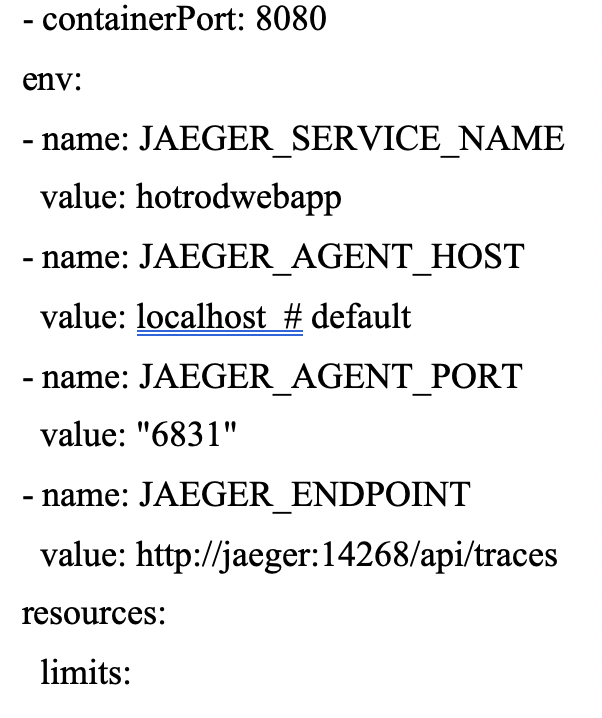
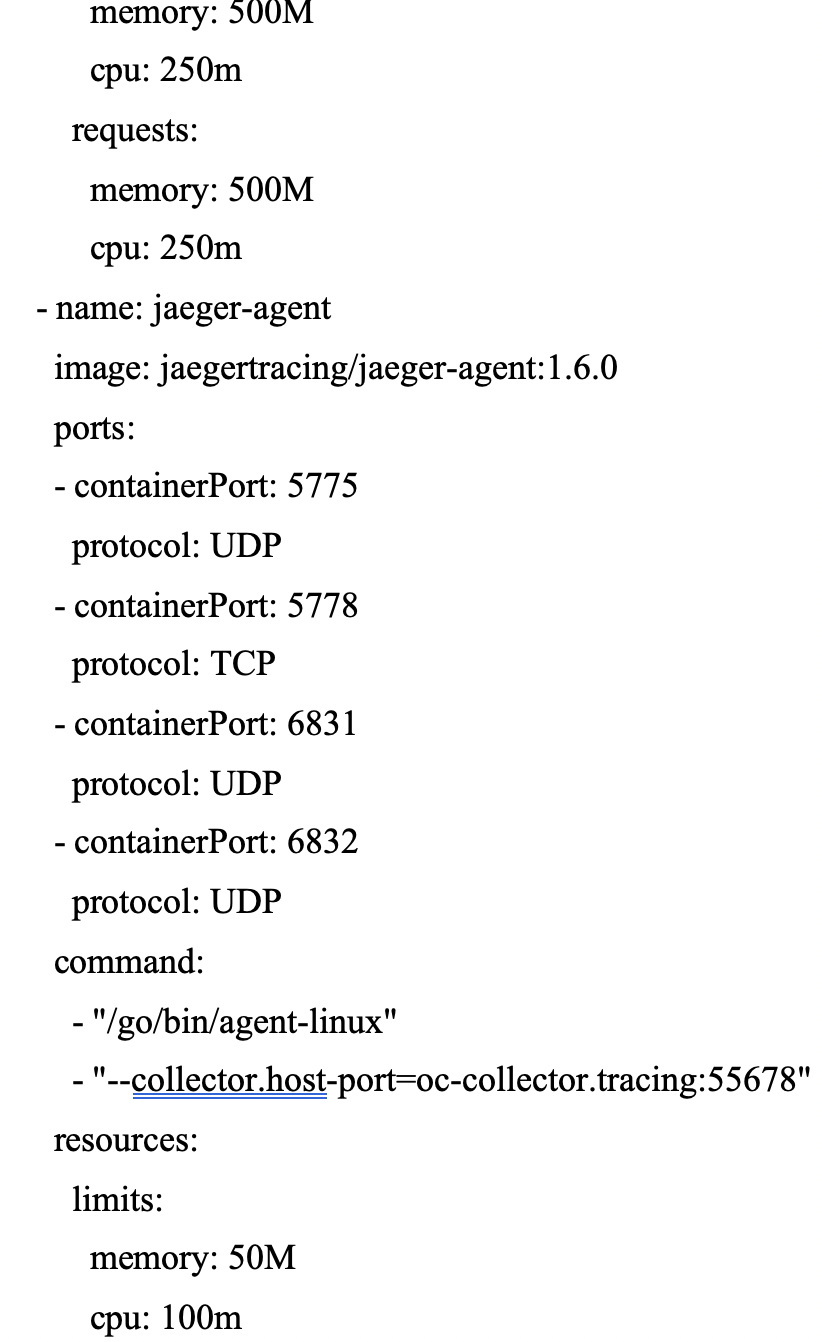
Below is an example of deployment manifest with the Jaeger environment variables. Apply the deployment manifest file to the Kubernetes cluster and access the application URL.
The Jaeger agent runs as sidecar to the application, as given in the below manifest with ports 5775, 5778,6831,6832 that are necessary for the Jaeger-client library to communicate to Jaeger agent. Additional environment variables details can be found here: https://github.com/jaegertracing/jaeger-client-go.
Note: As mentioned earlier, the application can send traces directly to a Jaeger collector endpoint or to a Jaeger agent. If a Jaeger endpoint variable is provided, traces will be sent to the http endpoint of the collector using httpsender, which overrides sending the traces to the Jaeger agent ports. If the endpoint is secured, basic authentication, JAEGER_AUTH_TOKEN variables have to be defined.
Example: Hotrod-web.yaml


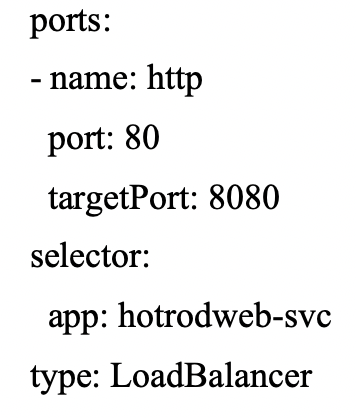
kubectl apply -f hotrod-web.yaml
Access the application url. Ex: (http://hotrodweb-svc-loadbalancerip).
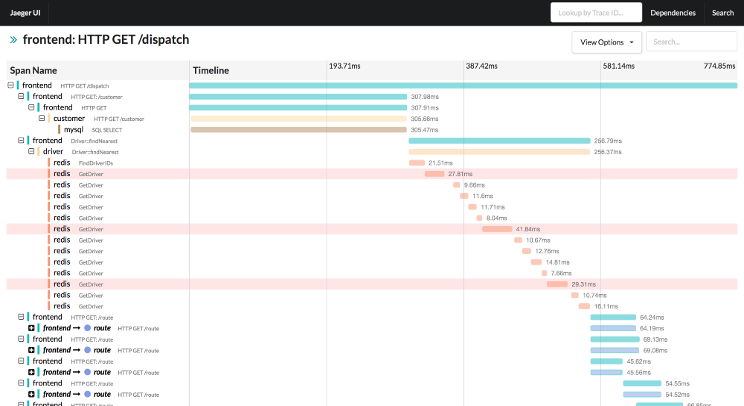
Once the application is up, the Jaeger UI can be accessed (http://jaeger-ui-service:nodeport) to verify the traces being sent to the collector from the application. Traces can be analyzed with timeline, resource dependencies for request or operation, drill down to see the failed requests and the span/logs for root cause analysis, compare request and response time, etc. A snapshot of the Jaeger UI with traces can be seen below.
Enabling tracing for an application needs a good understanding of the application and how to apply context propagation with span and traces while deploying the distributed tracing infrastructure, for effective distributed tracing of microservices. Distributed tracing is essential for root cause analysis to understand the issues, correlation and context of the requests communicating between the microservices. When used along with observability by monitoring golden signals, it can help troubleshoot issues faster, resulting in improved productivity in a distributed architecture development.
