
Are You Tracing Kubernetes Effectively?
Distributed tracing, like logging and observability, is a key functionality for keeping your services healthy and predictable. Contrary to logs and observability, which shows what happens on a service, tracing allows developers and operators to follow a specific request and how it calls different services and dependencies. It is designed around microservices architecture, which—unlike monolith architecture—uses many small services to run a platform. These services communicate with each other as well as with external services to provide and store the information users request.
Using microservices over monolith architecture certainly has its benefits:

- Easier to maintain: This is because it simplifies development, testing and deployment.
- More scalable: You can increase or decrease the number of service instances without touching other parts of the system.
The downside is it also decreases error and bottleneck detection capabilities, making it much harder to detect why and where a request failed.
Distributed tracing addresses this by simplifying detection through monitoring both requests and how data is exchanged between services (see Figure 1). The collected data then provides information on which service or request failed or slowed down.
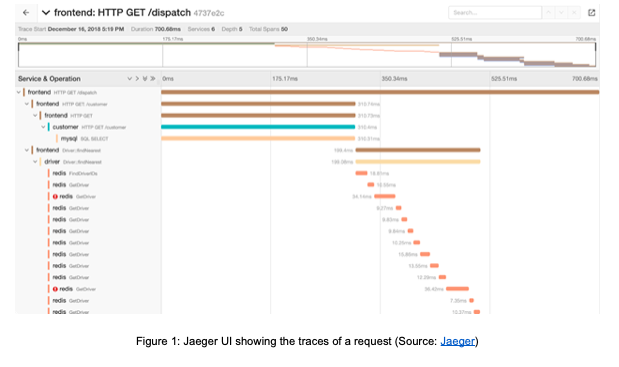
(Source: Jaeger)
Kubernetes is one of the most popular microservices platforms today. This container orchestrator allows you to easily manage multiple servers/nodes running dozens of services deployed using a simple declarative language.
In the next section, we’ll look at several popular distributed tracing solutions and show how they work in the Kubernetes environment.
Kubernetes Distributed Tracing Solutions
There are a few tools available for implementing distributed tracing in Kubernetes, each offering different capabilities. Here, we review several of the most popular distributed tracing platforms that work with Kubernetes, covering a diverse range of tools:
- The well-established Zipkin tool
- Jaeger, a more modern approach to Zipkin’s concept
- Grafana Tempo, which stores data in a completely different way than the previous two tools
- A managed service, AWS X-Ray
Jaeger
Jaeger is an open source distributed tracing tool that was initially developed by Uber. It is designed to run in production with only a minor performance hit. It has many moving parts (see Figure 2), which can help increase throughput but may complicate deployment. These include sideloaded agents, Kafka services, the database and more.
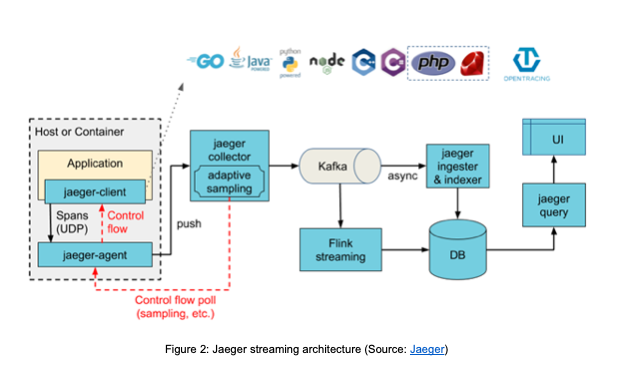
Figure 2: Jaeger streaming architecture (Source: Jaeger)
Each service must be instrumented by modifying its source code using one of the supported libraries, though there are some unofficial libraries for other platforms as well. These clients are based on the OpenTracing API, and are designed to always be enabled in production. But tracing does come with a computational cost, and data must be sampled so that it doesn’t impact overall performance.
By default, the Jaeger client samples 0.1% of traces, and is able to apply the correct sampling strategy through the Jaeger central backend, without requiring a specific configuration for each of its services.
Jaeger’s documentation has an entire section dedicated to deployment with Kubernetes, so it’s not very hard to deploy a simplified version. Jaeger features a Kubernetes operator that must be installed and configured prior to deployment and offers three deployment strategies:
- AllInOne is designed for testing purposes. All services are deployed into a single pod with in-memory storage. The downside is that it doesn’t offer scalability, nor is it reliable.
- Production allows for a more reliable and performant distributed tracing application with multiple replicas and persistent storage; it also supports Elasticsearch or Cassandra databases.
- Streaming is essentially an improved Production strategy in which a Kafka service is used for data ingestion. This reduces the pressure on storage, allowing for improved querying and data visualization.
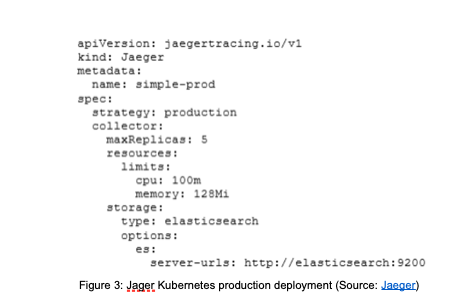
Figure 3: Jaeger Kubernetes production deployment (Source: Jaeger)
Each of the above three strategies requires an agent as a sidecar service that can connect to instrumentation libraries and push tracing data to a collector. Each deployment needs an annotation of value “sidecar.jaegertracing.io/inject”: “true” to instruct the Jaeger operator that the deployment will be observed. Note that this feature is only available for deployments, while other types of Kubernetes components (e.g., pods and ReplicaSets) must have the agent manually installed.
Zipkin
Initially inspired by Google Dapper and originally developed by Twitter, Zipkin is now an OSS organization with a dedicated community. It has similar functionality to and requirements of Jaeger. Compared to Jaeger, though, Zipkin has a simpler, non-distributed architecture that simplifies deployment. It does not scale as well as Jaeger, however, since all services are built in the same artifact. Figure 4 illustrates the Zipkin design architecture.
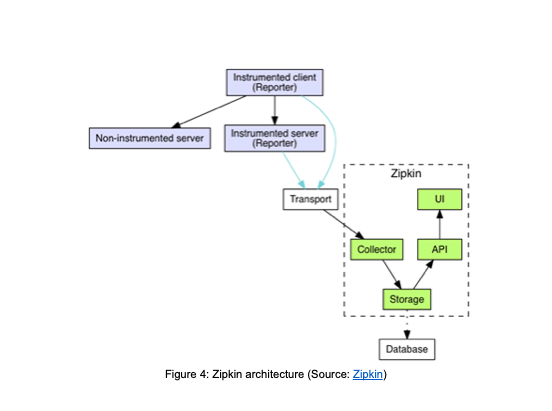
Figure 4: Zipkin architecture (Source: Zipkin)
Zipkin is an older service than Jaeger, and offers a greater number of supported languages and platforms through official and community supported libraries. Sampling, on the other hand, is dependent on the client library with no central configuration or uniformity. Libraries have their own strategies and configuration properties to define how data will be sampled, and Zipkin stores all the data it receives.
While Zipkin doesn’t offer a well-defined way of being deployed on Kubernetes—neither for agents nor for its service—it provides a Docker image for its service that you can easily run in your environment. The image can run everything in memory or use external storage such as Cassandra, MySQL or Elasticsearch. However, it does not support multiple Zipkin instances, so scalability is limited.
There are also no agents/sidecars. Instead, everything must be configured inside the application client library. This means more work for human operators, since each library and platform can have different configuration properties. Using a configuration provider such as Kubernetes ConfigMap can help somewhat in addressing these problems, but the application being instrumented must be compatible with the service.
Grafana Tempo
Announced in 2020, Grafana Tempo is a new contender designed to address specific issues with other distributed tracing tools, particularly the use of large servers and difficulties with data sampling. Other systems spend too many resources by indexing traced data, which leads to higher costs and requires complex storage systems (e.g., Cassandra or Elasticsearch). And while these systems are capable of handling huge amounts of data, you’ll need to pay more to deploy a large cluster.
Grafana Tempo, on the other hand, relies on object storage services (e.g., Amazon S3) and uses its query engine to discover the tracing information, which is also used by other Grafana services. Thus, while the storage cost is cheaper, the query is expensive due to more time consumed and the fact that you’re using more CPU resources. See the Grafana Tempo architecture in Figure 5 below.
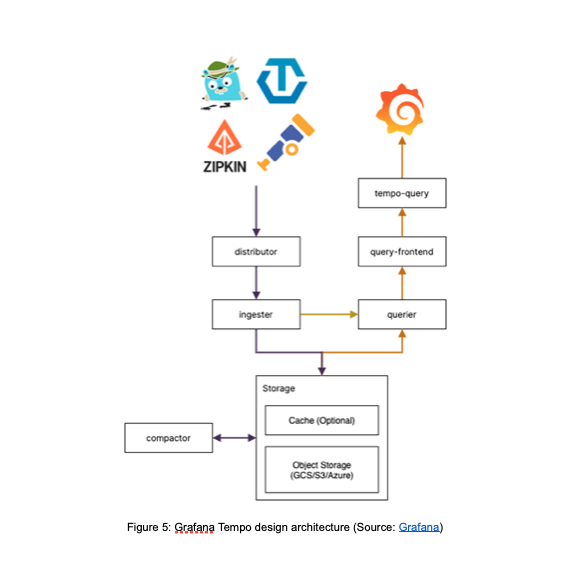
Figure 5: Grafana Tempo design architecture (Source: Grafana)
While the Grafana Tempo platform hasn’t been around long, it has a well-supported set of libraries and can use existing client instrumentation libraries from Jaeger, OpenTelemetry or Zipkin.
Tempo works by collecting all generated data. This can be good for debugging, but it may lead to performance issues when capturing data. By using the Jaeger or OpenTelemetry libraries, you can configure sampling manually.
Despite being a new project, it offers nothing out of the ordinary for Kubernetes deployment. Installation will require deploying the following services on your cluster.
- Tempo backend
- Tempo-query engine
- Prometheus
- Grafana
As for storage, all you need is basic object storage that’s easily available in any cloud platform. Tempo also listens to several ports, one for each protocol (see Table 1), ensuring you use the best instrumentation library available:
|
Protocol |
Port |
|
OpenTelemetry |
55680 |
|
Jaeger – Thrift Compact |
6831 |
|
Jaeger – Thrift Binary |
6832 |
|
Jaeger – Thrift HTTP |
14268 |
|
Jaeger – GRPC |
14250 |
|
Zipkin |
9411 |
Table 1: Available Tempo protocols (Source: Grafana)
As with Zipkin, there’s no agent or sideload service to simplify deployment and configuration. Each system must have the correct configuration, which increases operational costs and necessitates a central configuration repository.
AWS X-Ray
AWS X-Ray is a managed service designed to provide seamless distributed tracing on services running inside AWS Cloud. As a vendor-specific tool, it does have some limitations when it comes to external services. Still, the AWS team provides libraries and agents even for self-hosted services like MySQL or PostgreSQL.
X-Ray provides libraries for Go, Java, Node.js, Python, Ruby and .Net. Like Jaeger, X-Ray uses a sideloaded agent to connect and push tracing data to the back end. This way, you can avoid putting large configuration properties inside the application at runtime and offload all data ingestion to another service. However, in a non-managed environment, this may add more complexity.
Using X-Ray with Kubernetes is remarkably simple, as you do not need to deploy any additional backend service or storage solution. The agent can be installed as a Kubernetes DaemonSet much like Jaeger (though Jaeger still offers simpler configuration, thanks to the Operator).
Distributed Tracing Tools Compared
Table 2 below shows a comparison of the above tools evaluated based on four categories: maturity, configuration, Kubernetes features and cost. They are ranked on each category from A (best) to C (worst):
- Maturity: Evaluates how stable and predictable the tool is.
- Configuration: Displays how easy it is to configure the tool and put it into production.
- Kubernetes features: Explains how well-aligned each service is for a Kubernetes environment.
- Cost: The cost to deploy the solution, including every aspect (e.g., storage services).
|
Service |
Maturity |
Configuration |
Kubernetes features |
Cost |
|
Jaeger |
B |
A |
A |
B |
|
Zipkin |
A |
C |
C |
B |
|
Grafana Tempo |
C |
B |
C |
A |
|
AWS X-Ray |
A |
A |
A |
C |
Table 2: Services comparison
There are several reliable solutions out there for distributed tracing, and new solutions that reduce costs without sacrificing functionality are emerging. Unfortunately, Kubernetes support is still insufficient.
Jaeger offers some pretty solid tools for working with Kubernetes, and AWS X-Ray features easy integration with AWS Services. As for Zipkin and Grafana Tempo, neither provides a standardized solution for Kubernetes. The operator, therefore, needs to deploy Docker images and a specific configuration for each application.
In addition to taking operational difficulties into account, you’ll definitely want to consider the costs of implementing these solutions. On the client side, all solutions rely on the embedded application library, while some also require additional agents. Adding another library is a time-consuming task that couples product code and infrastructure code. This can make it difficult to switch to another tracing tool (though most are cross-compatible). This also requires significant effort and expertise and is essentially a long-term commitment.
On the backend side, Jaeger and Zipkin rely on traditional storage solutions in which indexes are built at the time of ingestion. This, of course, considerably increases the cost of storing all that data. Tempo, on the other hand, relies solely on object storage, which is the cheapest cloud storage solution available.
Distributed tracing is a must for every microservices architecture: it allows you to detect issues quickly and offers valuable insights that can decrease response time from hours to minutes. Distributed tracing combined with Kubernetes, the most prominent microservices platform available today, makes for a powerful toolset for every operator.
