Pixie Labs Previews Observability Platform for Kubernetes Apps
Fresh off raising $9.15 million in funding, Pixie Labs has emerged from stealth to launch an observability platform that can be deployed natively on Kubernetes clusters to begin analyzing data in a few minutes.
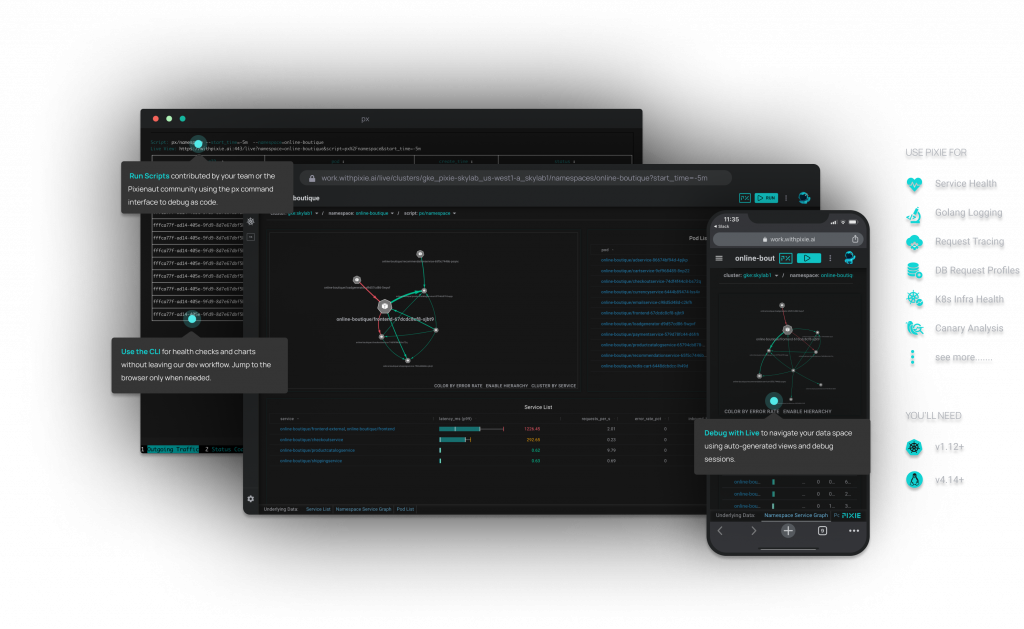
Pixie Labs CEO Zain Asgar says unlike legacy monitoring tools that can take months to set up and require days of manual data wrangling, the Pixie platform is a distributed machine data system that creates streaming telemetry pipelines.
That data from those pipelines can be employed to create artificial intelligence (AI) models to optimize Kubernetes environments or consumed via scripts and debugging interfaces fed into existing monitoring tools, adds Asgar.
Available in beta via an early access program, Pixie also makes it possible to employ the extended Berkeley Packet Filter (eBPF) at the Linux kernel level to automatically collect baseline data such as metrics, traces, logs and events, Asgar notes. That approach eliminates the need to individually instrument every application deployed on a Kubernetes cluster using agent software that needs to be maintained, updated and secured.
The goal, Asgar says, is to create an observability platform designed primarily for developers rather than IT operations, which historically have focused their efforts on monitoring individual components of an IT environment. That approach may work when IT teams are trying to monitor one or two clusters, but as more applications are deployed across a distributed Kubernetes environment, it becomes apparent there is a need for a more efficient approach to observability, he notes.
As a core tenet of best DevOps practices, observability is gaining traction as IT organizations transition to management tools that provide more context. Not only are legacy tools that monitor isolated components challenging to set up and maintain, but also the reports created must be correlated with one another to determine the root cause of an issue. IT teams often can analyze data for weeks to discover an issue that only takes a few minutes to fix.
Observability tools, in contrast, collect data in real-time from the entire application environment to make it easier to discover the root cause of an issue. As IT environments become more complex, the data collected by those legacy monitoring tools becomes only a small piece of a much larger puzzle. In many cases, the cost of acquiring an observability tool will be covered simply by eliminating the need to license any number of legacy monitoring tools.
Competition among providers of observability platforms is already fierce. In addition to providers of legacy monitoring tools that are transforming their offerings into unified observability platforms, there is a small army of startup companies that are in launching observability platforms. Each IT organization will need to determine which approach makes the most sense for them based on their existing investments and types of applications they need to observe.
However, the days when developers and IT operations teams regularly need to come together in a “war room” to resolve performance issues may be coming to an end. There will, of course, always be issues to address; the difference is they may not escalate to the point where everyone on the IT team will need to be involved quite as often.


