
Setting Up Scalable Monitoring With Prometheus, Grafana and Mimir on Kubernetes
When I was working at a start-up, our goal was to set up a monitoring solution to track infrastructure components such as virtual machines and applications, all while staying within a limited budget and adhering to a short timeframe. To achieve this, I chose open-source tools such as Prometheus, Grafana, Mimir and Nginx. Since we were hosted on Google Cloud, the easiest way to get started with infrastructure and application monitoring using these tools was by deploying them on Google Kubernetes Engine (GKE). However, this guide can easily be adapted to set up monitoring on any cloud platform.
The open-source monitoring stack we selected included:

- Prometheus: A time-series database (TSDB) that collects and stores metrics from infrastructure and applications
- Mimir: A scalable, long-term storage backend that extends Prometheus by managing large volumes of time-series data
- Grafana: A rich visualization and monitoring tool that displays collected metrics in dashboards and supports alerting based on thresholds
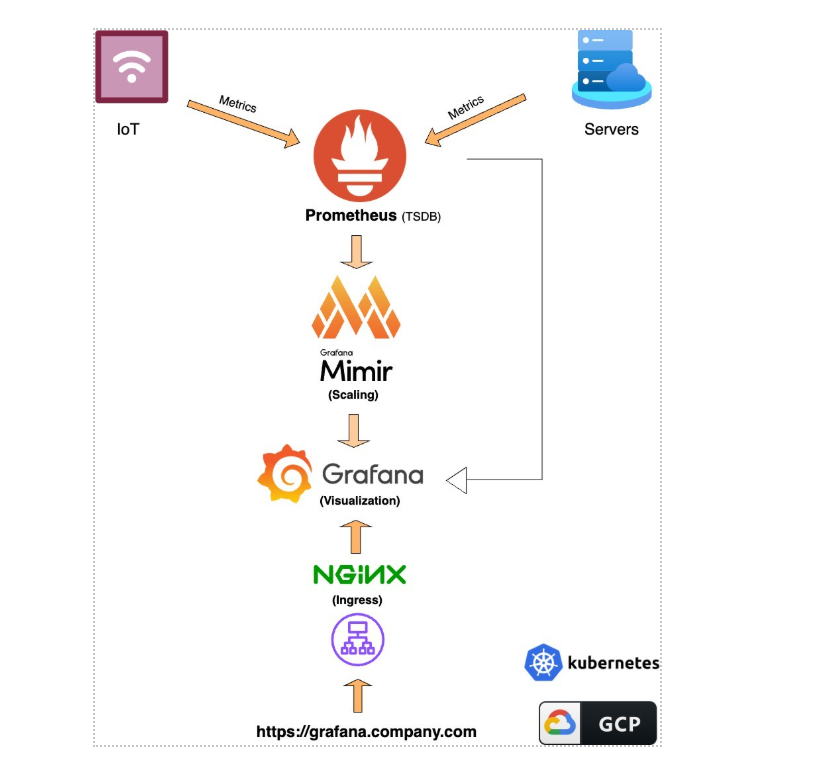
Component Descriptions and Flow
- IoT Devices, Servers and Applications: These are the data sources emitting metrics such as CPU usage, memory utilization and custom application-specific metrics.
- Prometheus (TSDB): It collects and stores time-series metrics from IoT devices, servers and applications.
- Grafana Mimir (Scaling Layer): It extends Prometheus by providing scalable, durable storage for large-scale metric workloads.
- Grafana (Visualization): It displays collected metrics in customizable dashboards and graphs and provides alerting capabilities.
- NGINX (Ingress Controller): It acts as a reverse proxy and secure access point for the Grafana and Prometheus user interfaces.
- Kubernetes: It orchestrates the entire monitoring stack as containerized services.
- Google Cloud Platform (GCP): It hosts the Kubernetes cluster and the supporting infrastructure.
Cluster Creation:
Below is the Terraform code to create a private Kubernetes cluster in GCP. A similar approach can be used to create private clusters in other cloud environments as well.
Note: In this setup, we are using a shared network from another project, so appropriate IAM permissions and network configurations must be applied.
Create a Kubernetes cluster using the terraform: cluster.tf
# google_client_config and kubernetes provider must be explicitly specified like the following.
data “google_client_config” “default” {}
provider “kubernetes” {
host = “https://${module.gke.endpoint}”
token = data.google_client_config.default.access_token cluster_ca_certificate = base64decode(module.gke.ca_certificate)
}
# Use selected cluster configuration module “gke” {
source = “terraform-google-modules/kubernetes- engine/google//modules/beta-private-cluster” version = “30.2.0”
project_id = var.cluster_config[local.env].project_id name = var.cluster_config[local.env].name
region = var.cluster_config[local.env].region zones = var.cluster_config[local.env].zones network = var.cluster_config[local.env].network
network_project_id = var.cluster_config[local.env].network_project_id subnetwork = var.cluster_config[local.env].subnetwork
ip_range_pods = “${var.cluster_config[local.env].subnetwork}-pods” ip_range_services = “${var.cluster_config[local.env].subnetwork}- services”
http_load_balancing = true enable_l4_ilb_subsetting = true network_policy = false horizontal_pod_autoscaling = true filestore_csi_driver = false enable_private_endpoint = true enable_private_nodes = true remove_default_node_pool = true master_ipv4_cidr_block = “172.16.0.0/28”
node_pools = [
{
name = “node-pool”
machine_type = var.cluster_config[local.env].machine_type node_locations = join(“,”, var.cluster_config[local.env].zones) min_count = 1
max_count = 1
local_ssd_count = 0 spot = false
disk_size_gb = var.cluster_config[local.env].disk_size_gb disk_type = “pd-standard”
image_type = “COS_CONTAINERD” enable_gcfs = false enable_gvnic = false logging_variant = “DEFAULT” auto_repair = true auto_upgrade = true
service_account = “${google_service_account.gke.email}” preemptible = false
initial_node_count = 1 autoscaling = false
},
]
node_pools_oauth_scopes = { all = [
“https://www.googleapis.com/auth/logging.write”, “https://www.googleapis.com/auth/monitoring”,
]
}
cluster_resource_labels = { environment = local.env
project = var.cluster_config[local.env].project_id, resource_type = “gke”,
resource_name = var.cluster_config[local.env].name customer = “all”
}
node_pools_labels = { all = {}
default-node-pool = true
}
}
node_pools_metadata = { all = {}
default-node-pool = {
node-pool-metadata-custom-value = “node-pool”
}
}
node_pools_taints = { all = []
default-node-pool = [
{
key = “default-node-pool” value = true
effect = “PREFER_NO_SCHEDULE”
},
]
}
node_pools_tags = { all = []
default-node-pool = [ “default-node-pool”,
]
}
master_authorized_networks = [
{
cidr_block = var.cluster_config[local.env].subnetwork_allow display_name = “VPC”
}
]
}
resource “google_compute_subnetwork_iam_member” “network_user_service_account” {
for_each = { for user in var.cluster_config[local.env].network_user : user => user }
project = var.cluster_config[local.env].network_project_id subnetwork = var.cluster_config[local.env].subnetwork region = var.cluster_config[local.env].region
role = “roles/compute.networkUser” member = “serviceAccount:${each.value}”
}
resource “google_project_iam_member” “hostServiceAgentUser_service_account” { for_each = { for user in
var.cluster_config[local.env].hostServiceAgent_user : user => user } project = var.cluster_config[local.env].network_project_id
member = “serviceAccount:${each.value}”
role = “roles/container.hostServiceAgentUser”
}
resource “google_project_iam_member” “serviceAgent_service_account” { for_each = { for user in var.cluster_config[local.env].serviceAgent_user
: user => user }
project = var.cluster_config[local.env].network_project_id member = “serviceAccount:${each.value}”
role = “roles/container.serviceAgent”
}
In the Terraform configuration above, we utilize the publicly available Google Terraform module terraform-google-modules/kubernetes-engine/google//modules/beta-private-cluster.. This approach allows us to leverage well-maintained, community-supported code, eliminating the need to develop complex infrastructure code from scratch and maintain it.
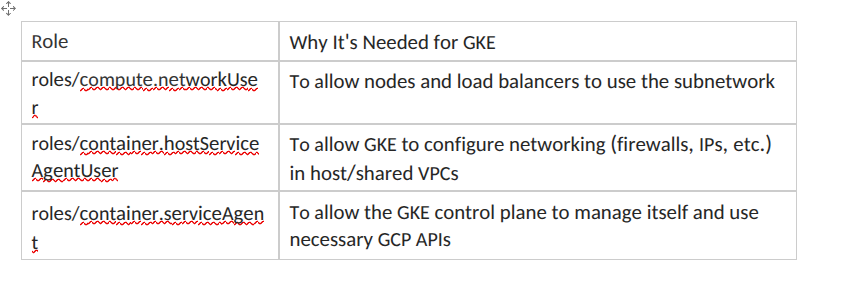
The permissions required for the service accounts used in this Terraform configuration are detailed below:
Terraform Variables:
Below are the variables we used in our Terraform code:
variables.tf
variable “cluster_config” {
description = “Cluster configuration per environment” type = map(object({
project_id = string name = string description = string regional = bool region = string zones = list(string) network = string subnetwork = string
network_project_id = string machine_type = string disk_size_gb = number subnetwork_allow = string bucket_names = list(string) host_project = string network_user = list(string)
hostServiceAgent_user = list(string) serviceAgent_user = list(string) static_ips = list(string)
# Add more attributes as needed
}))
default = { nonprod-mon = {
project_id = “nonprod-monitoring” name = “cluster-nonprod” description = “nonprod cluster” regional = true
region = “us-central1”
zones = [“us-central1-a”, “us-central1-b”, “us-central1-c”] network = “nonprod-vpc”
subnetwork = “nonprod-us-central1-sb01” subnetwork_allow = “10.226.0.0/22” network_project_id = “nonprod-networking” machine_type = “e2-custom-4-10240” disk_size_gb = “50”
bucket_names = [“mon_blocks_storage”, “mon_alertmanager_storage”, “mon_ruler_storage”]
host_project = “nonprod-networking”
network_user = [“service-123456789123@container-engine- robot.iam.gserviceaccount.com”, “[email protected]”] hostServiceAgent_user = [“service-123456789123@container-engine- robot.iam.gserviceaccount.com”]
serviceAgent_user = [“service-123456789123@container-engine- robot.iam.gserviceaccount.com”]
static_ips = [“internal-ingress”]
}
}
}
Terraform State:
A GCS bucket is used to store the Terraform state information:
backend.tf
terraform { backend “gcs” {
bucket = “environments-state” prefix = “terraform/state/gke”
}
}
Terraform Workspace:
We are using Terraform workspaces, so ensure that you configure your workspace before running the Terraform code. For example, you can set the workspace with the following command:
terraform workspace set non-prod
In the main.tf file, we define the workspace as: main.
locals {
env = terraform.workspace
}
This automatically sets the env local variable to match the current Terraform workspace (e.g., non-prod , prod ), allowing the configuration to adjust dynamically based on the selected environment.
Static IPs
We need static IP addresses to configure DNS records to allow us to access services using domain names such as prometheus.company.xyz or grafana.company.xyz. static_ips.tf
data “google_compute_subnetwork” “subnet” { name = var.cluster_config[local.env].subnetwork
project = var.cluster_config[local.env].network_project_id region = var.cluster_config[local.env].regi
resource “google_compute_address” “static_ips” {
for_each = { for ip in var.cluster_config[local.env].static_ips : ip => ip }
name = each.value address_type = “INTERNAL”
region = var.cluster_config[local.env].region
subnetwork = data.google_compute_subnetwork.subnet.self_link project = var.cluster_config[local.env].project_id
}
service_account.tf
resource “google_service_account” “gke” { account_id = “gke-${local.env}”
project = var.cluster_config[local.env].project_id display_name = “Service account for gke”
}
Mimir GCS Buckets:
We need Google Cloud Storage (GCS) buckets for Mimir’s long-term metric storage to allow us to efficiently scale and persist large volumes of time-series data.
gcs_buckets.tf
module “gcs_buckets” {
source = “terraform-google-modules/cloud-storage/google” version = “~> 5.0”
project_id = var.cluster_config[local.env].project_id location = “US”
storage_class = “STANDARD”
names = var.cluster_config[local.env].bucket_names labels = {
environment = local.env
project = var.cluster_config[local.env].project_id resource_type = “gcs”
customer = “all”
}
}
resource “google_storage_bucket_iam_binding” “buckets” {
for_each = { for bucket in var.cluster_config[local.env].bucket_names : bucket => bucket }
bucket = each.value
role = “roles/storage.objectAdmin” members = [
“serviceAccount:${google_service_account.gke.email}”
]
depends_on = [module.gcs_buckets]
}
Namespaces (Kubernetes):
Once the cluster is set up, create the following namespaces:
- Prometheus
- Mimir
- Grafana
- Nginx-Ingress
Installation (Helm Charts):
Use Helm charts to install the various monitoring software in their respective namespaces. Below is an example for Prometheus, but you can apply this approach to install other software such as Grafana, Mimir and the NGINX Ingress Controller.
Prometheus: https://github.com/prometheus-community/helm-charts
Grafana: https://github.com/grafana/helm-charts
Mimir: https://grafana.com/docs/helm-charts/mimir-distributed/latest/get-started–helm- charts/
Nginx Controller: https://github.com/kubernetes/ingress-nginx/tree/main/charts/ingress- nginx.
Helm Commands:
First, add the Prometheus Helm repository and update it:
helm repo add prometheus-community https://prometheus- community.github.io/helm-charts
helm repo update
Next, pull the Prometheus chart:
helm pull prometheus-community/prometheus –untar
This will create a prometheus/ directory in your current working directory, containing the chart contents. You can modify the default prometheus/values.yaml file before installing it, allowing you to set custom configurations such as the admin password, persistence settings and service type.
Now, you can install Prometheus with the custom values_prod.yaml file:
helm install prometheus ./prometheus -f prometheus/values_prod.yaml -n monitoring
Similarly, you can install the other components:
helm install grafana ./grafana -f grafana/values_prod.yaml -n monitoring helm install mimir ./mimir -f mimir/values_prod.yaml -f mimir/capped- small.yaml -n mimir
helm install nginx-ingress ./nginx-ingress -f nginx/values_prod.yaml -n ingress
Configuration (values.yaml Files):
Ingress:
An Ingress controller is required to manage Ingress resources. Simply creating an Ingress resource will have no effect unless there is an Ingress Controller in place. While there are many Ingress Controllers available, including GKEʼs built-in Ingress, I’ve chosen the NGINX Ingress Controller for various reasons.
Ingress exposes HTTP and HTTPS routes from outside the cluster to services within the cluster. Traffic routing is controlled by the rules defined within the Ingress resource.
In this tutorial, we are using an internal IP to expose the services. Make sure to configure the following in your helm values.yaml to ensure proper routing and access:
Helm values.yaml
controller:
service:
internal:
enabled: true annotations:
# Create internal LB. More information: https://cloud.google.com/kubernetes-engine/docs/how-to/internal-load- balancing
# For GKE versions 1.17 and later networking.gke.io/load-balancer-type: “Internal” # For earlier versions
# cloud.google.com/load-balancer-type: “Internal” # Any other annotation can be declared here.
Also, provide the static internal IP you created earlier via Terraform in the
loadBalancerIP field as:
Helm values.yaml
loadBalancerIP: “10.x.x.x”
Once the NGINX Ingress controller is installed, it will create a cloud load balancer with your cloud provider (e.g., GCP). Afterward, you need to create Ingress resources to route traffic to the appropriate destinations, such as Grafana and Prometheus.
The Ingress spec contains all the necessary information required to configure a load balancer or
proxy server. To ensure that the traffic is routed correctly, you must include either the ingressClassName: nginx spec field or the kubernetes.io/ingress.class : nginx annotation in your Ingress resources.
Ingress Resource:
my–ingress–prod.yaml
apiVersion: networking.k8s.io/v1 kind: Ingress
metadata:
name: company-ingress namespace: monitoring spec:
ingressClassName: nginx rules:
- host: grafana.company.com http:
paths:
- path: / pathType: Prefix backend: service:
name: grafana port:
number: 80
- host: prometheus.company.com http:
paths:
- path: / pathType: Prefix backend: service:
name: prometheus-server port:
number: 80
What it Does
- Ingress Controller: It uses the nginx Ingress controller to manage the routing of the external traffic to internal services.
- Routing Rules:
- grafana.company.com: Traffic directed to grafana.company.com will be routed to the grafana service, specifically to port 80.
- prometheus.company.com: Traffic directed to prometheus.company.com will be routed to the prometheus-server service, specifically to port 80.
- Path Handling: Both routes use path: / , meaning that any URL that starts with / will be forwarded to the respective services (Grafana or Prometheus).
This configuration ensures that traffic coming to the specified domains is directed to the correct service inside your Kubernetes cluster, based on the hostname and path.
Prometheus:
If you’re using the pull model, Prometheus needs to collect metrics from your targets, for which, you can set up the scrape configuration as follows in your values.yaml file:
Helm values.yaml
scrape_configs:
- job_name: prometheus static_configs:
- targets:
- localhost:9090
If Prometheus requires scaling, it needs to forward the metrics to Mimir for long-term storage. You can configure Prometheus to send a copy of the metrics to Mimir by using the remoteWrite section in the Prometheus Helm values.yaml file as:
Helm values.yaml
remoteWrite:
The idea behind using Mimir is to provide long-term storage for Prometheus metrics. This setup allows you to scale Prometheus as needed while avoiding failure.
I recommend enabling persistent volume claims (PVC) for Prometheus pods. This ensures that your data is not lost when remoteWrite is enabled, or in case you’re only using a single Prometheus instance and want to have a fallback in the event Mimir encounters issues.
Enabling persistent storage in the Helm values.yaml file ensures that the data is retained through pod restarts.
Helm values.yaml
persistentVolume:
## If true, Prometheus server will create/use a Persistent Volume Claim ## If false, use emptyDir
##
enabled: true accessModes:
– ReadWriteOnce ## Prometheus server data Persistent Volume mount root path
##
mountPath: /data
## Prometheus server data Persistent Volume size ##
size: 500Gi
# storageClass: “-“
storageClass: “persistent-disk-rwo”
Set retention time carefully ( –storage.tsdb.retention.time ) in helm values.yaml
Helm values.yaml
## Prometheus data retention period (default if not specified is 15 days)
##
retention: “90d”
Adjust the above values as per your needs.
Mimir:
Grafana Mimir is an open-source, horizontally scalable, multi-tenant time-series database and monitoring platform. Mimir is fully compatible with Prometheus, meaning that it supports the Prometheus data model, query language (PromQL) and scraping mechanism. It can serve as a backend to store Prometheus metrics, enabling you to scale beyond what a single Prometheus server can manage. With efficient data storage and compression techniques, Mimir helps reduce the cost of storing long-term metric data. Mimir is useful in:
- Storing large volumes of time-series data long-term
- Scaling Prometheus beyond a single instance
- Using isolated storage with multi-tenancy support
- Ensuring distributed, fault-tolerant metric storage
Grafana Mimirʼs architecture is based on the principles of distributed systems, using components such as:
- Distributor: It receives and writes data from Prometheus instances or any compatible scraper.
- Ingester: It stores and processes incoming data. The data is held temporarily in the Ingester until it is flushed to long-term storage.
- Store Gateway: It handles the retrieving of data from persistent storage and serves queries.
- Query Frontend: It manages query execution and routing, ensuring that queries are distributed across the available Mimir instances.
- Storage Backend: In our tutorial Mimir uses GCS storage backends.
The GCS storage backends used by Mimir are mon_blocks_storage, mon_alertmanager_storage and mon_ruler_storage , which we have configured in our Terraform code.
In the Helm values.yaml file, configure the GCS buckets for storage along with the credentials necessary to access these GCS storage buckets. This allows Mimir to interact with Google Cloud Storage for long-term metric storage.
Helm values.yaml
# — Additional structured values on top of the text based ‘mimir.config’. Applied after the text based config is evaluated for templates. Enables adding and modifying YAML elements in the evaluated ‘mimir.config’.
# To modify the resulting configuration, either copy and alter ‘mimir.config’ as a whole or use the ‘mimir.structuredConfig’ to add and modify certain YAML elements.
structuredConfig:
limits:
out_of_order_time_window: 1h max_label_names_per_series: 100 common:
storage:
backend: gcs gcs:
service_account: |
{
“type”: “service_account”, “project_id”: “prod-monitoring”, “private_key_id”: “50885800”,
“private_key”: “xxxxx—–END PRIVATE KEY \n”,
“client_email”: “[email protected]”, “client_id”: “108488885”,
“auth_uri”: “https://accounts.google.com/o/oauth2/auth”, “token_uri”: “https://oauth2.googleapis.com/token”, “auth_provider_x509_cert_url”: “https://www.googleapis.com/oauth2/v1/certs”, “client_x509_cert_url”: “https://www.googleapis.com/robot/v1/metadata/x509/gke-prod%40prod- monitoring.iam.gserviceaccount.com”,
“universe_domain”: “googleapis.com”
}
blocks_storage:
backend: gcs gcs:
bucket_name: mon_blocks_storage alertmanager_storage:
gcs:
bucket_name: mon_alertmanager_storage
ruler_storage:
gcs:
bucket_name: mon_ruler_storage
Based on your requirements, use either the capped-small.yaml or capped-large.yaml values files to assign compute resources to the Mimir components. These files allow you to configure the CPU and memory limits for Mimir depending on the scale of your deployment.
Additionally, Mimir has an active community on Slack where you can seek help from other members while setting it up in your cluster.
Grafana:
In Grafana, add Mimir as a data source for long-term metric storage. If you’re using only a single Prometheus instance, you can also add Prometheus as a data source for backup purposes. Once the data sources are set up, you can visualize the metrics, configure dashboards and create alerts in Grafana.
Additionally, enable persistent volume claims (PVC) for Grafana to ensure that data is not lost if the pod restarts. This helps retain the configuration and data even through pod lifecycle changes.
Helm values.yaml
## Enable persistence using Persistent Volume Claims
## ref: http://kubernetes.io/docs/user-guide/persistent-volumes/ ##
persistence:
type: pvc enabled: true
storageClassName: persistent-disk-rwo accessModes:
– ReadWriteOnce size: 10Gi
DNS
Once everything is installed and configured, configure the DNS to point to the static IP you created earlier ( 10.x.x.x ) using Terraform.
After completing this configuration, you should be able to access the metrics in Grafana. From there, you can visualize the data, create custom dashboards and set up alerts.
For more details on creating dashboards and visualizing data in Grafana, refer to the dashboards.
