
Unlocking Kubernetes Chaos: AI Anomaly Detection That Slays MTTR
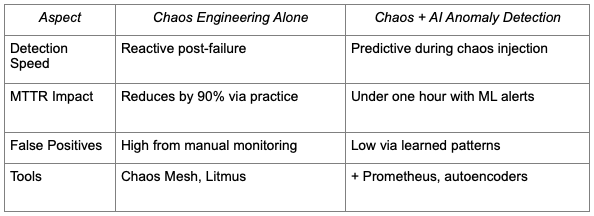
Kubernetes environments face constant threats from failures, spikes and hidden anomalies that spike downtime and mean time to recovery (MTTR). This blog explores fusing chaos engineering with AI anomaly detection for building unbreakable clusters and slashing recovery times dramatically. Teams using these approaches achieve MTTR of under one hour while boosting availability beyond 99.9%.
Chaos Engineering Basics
Chaos engineering refers to intentionally causing malfunctions in production-like systems to demonstrate flexibility. Netflix tests hypotheses generated by Chaos Monkey under real-world stressors on steady-state behavior, such as pod kills, network latency or other network disruptions. In Kubernetes, tools simulate node downtime, resource exhaustion and traffic spikes to detect vulnerabilities before they cause outages.

Teams start small with blast radius controls, such as namespace isolation, to avoid widespread disruption. Gremlin’s 2021 report shows that practitioners reduce MTTR by over 90% through regular experiments, with 23% resolving issues in under an hour. Kubernetes-native platforms such as Chaos Mesh use CRDs for fault injection, integrating seamlessly with operators for scheduled tests.
Kubernetes Chaos Tools
Popular open-source tools driving Kubernetes chaos experiments include:
- Chaos Mesh: CNCF incubating project for network, pod, disk and kernel faults via YAML or UI; supports workflows and RBAC
- LitmusChaos: CNCF tool for CI/CD-integrated tests such as pod failures and CPU stress; used to harden apps across environments
- Gremlin: Enterprise-grade with Kubernetes-specific attacks; emphasizes safe, isolated experiments
These tools reduce MTTR by proactively identifying failure modes, and 60% of users report running Kubernetes chaos weekly.
AI Anomaly Detection Explained
AI anomaly detection uses machine learning (ML) to detect deviations from Kubernetes’ normal behavior in metrics logs and traces. Unlike fixed-boundary models, such as Isolation Forest and autoencoders, which learn baselines from historical data points (e.g., sudden CPU spikes) or from context (e.g., unusual capsule sizing), these methods learn baselines from anomalies in historical data.
In dynamic clusters, unsupervised learning excels without labeled data, analyzing time-series via LSTMs for predictive alerts. Tools integrate with Prometheus for metrics and Falco for runtime security, cutting false positives versus rule-based systems. Frameworks process multi-source data — API calls, network flows, resource usage — for holistic threat detection.
Integrating Chaos With AI
Chaos engineering generates rich datasets for training AI models, creating a feedback loop that accelerates anomaly detection. It injects faults via Chaos Mesh, captures telemetry with Prometheus, then retrains models on failure patterns to predict real incidents faster.
This synergy slays MTTR: Chaos exposes vulnerabilities; AI detects them in real-time during steady operation. A Cummins study showed AI frameworks outperforming rules in accuracy and recall for Kubernetes threats such as zero-days. Netdata plus ML immunological algorithms provide real-time cluster monitoring with adaptive baselines.
Real-World Implementations
Companies such as those using Harness automate chaos in Kubernetes pipelines, testing fault tolerance for high availability. LitmusChaos experiments reduced MTTR by 55% by catching failures in pre-production.
In security, AI spots insider threats via Kubernetes API anomalies, integrating with OPA for policy enforcement. vCluster enables isolated virtual clusters for safer chaos testing closer to production. Gremlin users hit 99.9% uptime by combining autoscaling with chaos-driven health checks.
Deployment Steps
Follow these steps to implement AI-enhanced chaos:
- Install Chaos Mesh: helm install chaos-mesh chaos-mesh/chaos-mesh –namespace=chaos-testing –create-namespace.
- Deploy Prometheus/Grafana for metrics collection.
- Train ML Model: Use Isolation Forest on historical pod metrics via Python scikit-learn.
- Run Chaos Experiment: Use YAML for pod-kill, monitor AI alerts.
- Automate in CI/CD: Using GitOps with ArgoCD triggers weekly GameDays.
Start in dev namespaces, measure MTTR pre/post and scale to staging.
Benefits Quantified
AI-chaos combos yield measurable gains. Availability exceeds 99.9%, with MTTR dropping to under 12 hours for 60% of teams. ML reduces false alerts, allowing SREs to focus on real issues.
Costs stay low with open-source stacks; Prometheus is free and Chaos Mesh scales efficiently. Gartner predicted that 80% of SREs would cut MTTR by 90% by 2023 via these practices — this has already been proven in 2025 deployments.
Challenges and Solutions
Dynamic scaling confounds baselines. Retrain models weekly on chaos data. Resource overhead from ML? Use lightweight edge models such as TinyML.
RBAC limits chaos scope — whitelist namespaces. Fear of breakage? Blast radius controls and rollback in tools like Chaos Mesh mitigate risks.
Future Trends
Edge AI will enable on-pod anomaly detection, minimizing latency. Federated learning across clusters shares patterns without data exposure.
Litmus 5.0 integrates generative AI for experiment generation. Expect serverless chaos as K8s evolves.
FAQ
1. What is MTTR in Kubernetes?
It is the average time taken to resolve incidents; chaos-AI slashes it via proactive detection.
2. Which is the best free chaos tool for beginners?
Chaos Mesh offers easy CRDs and UI for K8s faults.
3. Does AI replace human monitoring?
No, it augments predictive alerts to reduce alert fatigue.
4. How to measure chaos success?
Track MTTR, availability and blast radius; aim for <1 hour recovery time.
Ready to chaos-proof your cluster? Deploy Chaos Mesh today and integrate Prometheus ML pipelines to slash your MTTR.
